|

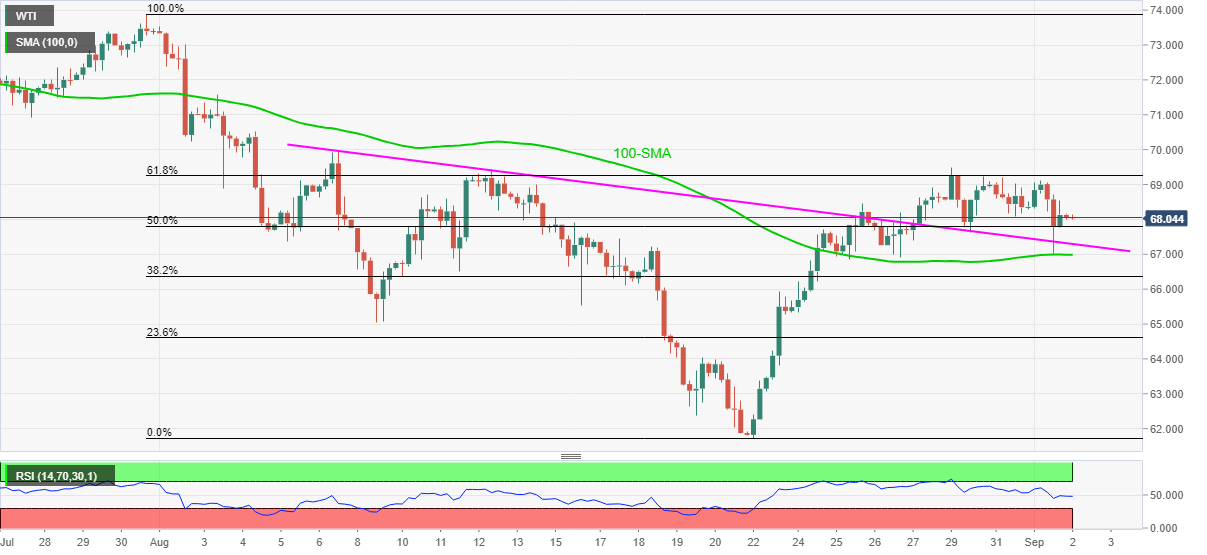
WTI Price Analysis: 100-SMA, previous hurdle back buyers around $68.00

  • WTI remains sidelined after two-day downtrend, defends bounce off short-term key supports.
  • Steady RSI adds to the bullish bias amid sustained trading beyond important supports.

WTI seesaws around $68.10, after a two-day downtrend, during Thursday’s Asian session.

In doing so, the oil benchmark defends the previous day’s U-turn from 100-SMA and the resistance-turned-support from August 06 amid steady RSI.

Given the quote’s ability to stay firmer beyond the short-term important support levels, WTI prices should recover.

However, a clear upside break of 61.8% Fibonacci retracement of July 30 to August 23, around $69.25, becomes necessary for the buyers to retake controls.

Following that, the $70.00 will validate the black gold’s rally towards late July’s peak close to $73.90.

Meanwhile, the stated support line near $67.30 restricts immediate losses of the WTI prices ahead of the 100-SMA level of $67.00.

Also acting as crucial support is the August 09 swing low near $65.00, a break of which will direct bears toward the last month’s low near $61.70.

WTI: Four-hour chart

Trend: Recovery expected

Additional important levels

Overview
Today last price68.09
Today Daily Change0.00
Today Daily Change %0.00%
Today daily open68.09
 
Trends
Daily SMA2067.16
Daily SMA5070.13
Daily SMA10068.29
Daily SMA20061.7
 
Levels
Previous Daily High69.11
Previous Daily Low67.02
Previous Weekly High68.91
Previous Weekly Low61.73
Previous Monthly High73.54
Previous Monthly Low61.73
Daily Fibonacci 38.2%67.81
Daily Fibonacci 61.8%68.31
Daily Pivot Point S167.04
Daily Pivot Point S265.98
Daily Pivot Point S364.95
Daily Pivot Point R169.13
Daily Pivot Point R270.16
Daily Pivot Point R371.22

Author

Anil Panchal

Anil Panchal

FXStreet

Anil Panchal has nearly 15 years of experience in tracking financial markets. With a keen interest in macroeconomics, Anil aptly tracks global news/updates and stays well-informed about the global financial moves and their implications.

More from Anil Panchal
Share:

Editor's Picks

EUR/USD struggles aroound 1.1800 as USD stabilizes

EUR/USD stays defensive around 1.1800 in the European session on Thursday. The US Dollar stabilizes, following the recent decline led by tariff uncertainty, capping the pair's upside. All eyes now remain on the US-Iran nuclear talks after ECB President Lagarde's testimony fails to impress Euro bulls. 

GBP/USD drops toward 1.3500 as USD finds fresh demand

GBP/USD falls back toward 1.3500 in the European session on Thursday, snapping its recovery momentum. The pair loses traction as the US Dollar finds fresh demand, as markets turn cautious ahead of the US-Iran nuclear talks. The US trade policy uncertainty also remains a drag on risk sentiment. 

Gold clings to gains amid sustained safe-haven flows ahead of US-Iran talks

Gold sticks to its modest intraday gains through the first half of the European session on Thursday, with bulls still awaiting a sustained move and acceptance above the $5,200 mark before placing fresh bets. 

Stellar: Relief bounce fades as bearish undertone persists

Stellar is trading around $0.16 at the time of writing on Thursday after rebounding more than 8% in the previous day. Derivatives data paints a negative picture as XLM’s short bets hit a monthly high while Open Interest continues to decline.

The one thing everyone is on the lookout for is US action of some sort against Iran

The FX market is minestrone soup these days. It is befuddled by conflicting data, rumors and small stories exaggerated out of proportion, and Trump-generated uncertainty. 

Solana strikes key resistance with double-digit gains

Solana trades at $88 at press time on Thursday, after an 11% upswing the previous day within a broader consolidation range of roughly three weeks. Institutional demand for Solana heightens as US spot SOL Exchange Traded Funds record $30 million of inflow on Wednesday.