WTI Price Analysis: 100-DMA guards the downside starting out a fresh week


  • WTI recovers a part of Friday’s sell-off, with eyes on oil reserves release.
  • The US oil is supported above the 100-DMA of $73.86 on the 1D chart.
  • RSI sees a fresh uptick but remains below the central line.

WTI (NYMEX futures) is making a recovery attempt on the $76 level after falling as low as $74.64 earlier in the Asian session on Monday.

With the rebound, the US oil reverses a small portion of Friday’s steep sell-off, led by the European covid lockdowns and a potential release of the oil reserve by major global economies, including the US, China and Japan.

From a short-term technical perspective, WTI has stalled its correction from multi-year peaks just above the 100-Daily Moving Average (DMA) at $73.86.

The rebound comes in tandem with the 14-day Relative Strength Index (RSI) also recovering from almost two-month lows.

Despite the renewed uptick in the RSI, the indicator continues to trade within the bearish territory, suggesting that any recovery is likely to remain short-lived.

A daily closing below the 100-DMA could open floors to a sharp tumble towards the ascending 200-DMA at $69.42.

Ahead of that level, the $70 round figure could offer some reprieve to WTI buyers.

 WTI: Daily chart

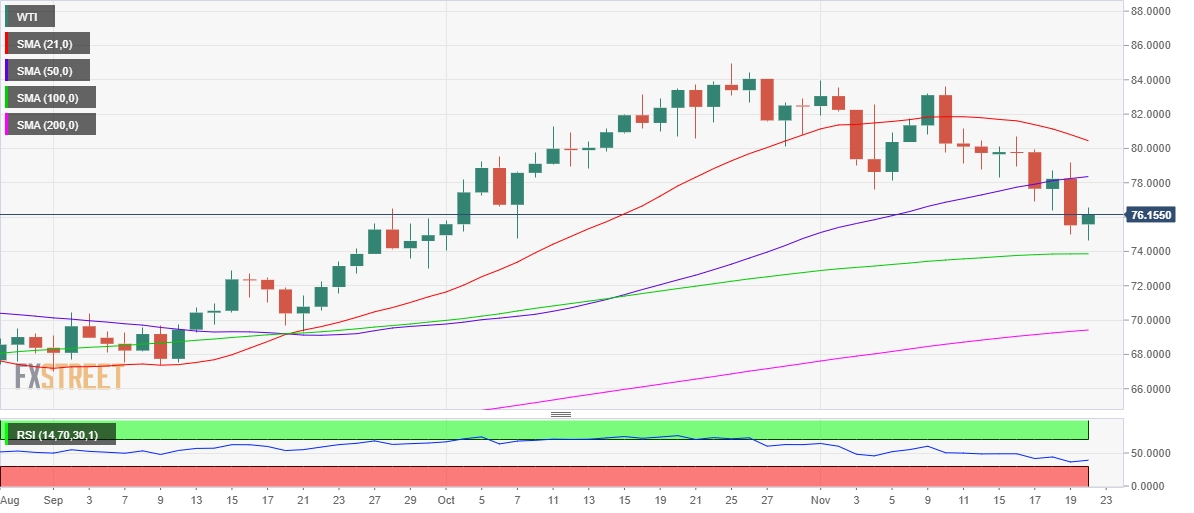
Alternatively, any recovery attempts could meet the initial supply at the $77 level, above which the upward-sloping 50-DMA at $78.36 would get tested.

Should the recovery momentum sustain then WTI bulls could look out for the next resistance at the bearish 21-DMA at $80.45.

WTI: Additional levels to watch

WTI

Overview
Today last price 76.15
Today Daily Change 0.66
Today Daily Change % 0.87
Today daily open 75.52
 
Trends
Daily SMA20 80.66
Daily SMA50 78.25
Daily SMA100 73.86
Daily SMA200 69.34
 
Levels
Previous Daily High 79.2
Previous Daily Low 75
Previous Weekly High 80.67
Previous Weekly Low 75
Previous Monthly High 84.98
Previous Monthly Low 74.06
Daily Fibonacci 38.2% 76.6
Daily Fibonacci 61.8% 77.59
Daily Pivot Point S1 73.95
Daily Pivot Point S2 72.38
Daily Pivot Point S3 69.75
Daily Pivot Point R1 78.14
Daily Pivot Point R2 80.77
Daily Pivot Point R3 82.34


Share: Feed news

Information on these pages contains forward-looking statements that involve risks and uncertainties. Markets and instruments profiled on this page are for informational purposes only and should not in any way come across as a recommendation to buy or sell in these assets. You should do your own thorough research before making any investment decisions. FXStreet does not in any way guarantee that this information is free from mistakes, errors, or material misstatements. It also does not guarantee that this information is of a timely nature. Investing in Open Markets involves a great deal of risk, including the loss of all or a portion of your investment, as well as emotional distress. All risks, losses and costs associated with investing, including total loss of principal, are your responsibility. The views and opinions expressed in this article are those of the authors and do not necessarily reflect the official policy or position of FXStreet nor its advertisers. The author will not be held responsible for information that is found at the end of links posted on this page.

If not otherwise explicitly mentioned in the body of the article, at the time of writing, the author has no position in any stock mentioned in this article and no business relationship with any company mentioned. The author has not received compensation for writing this article, other than from FXStreet.

FXStreet and the author do not provide personalized recommendations. The author makes no representations as to the accuracy, completeness, or suitability of this information. FXStreet and the author will not be liable for any errors, omissions or any losses, injuries or damages arising from this information and its display or use. Errors and omissions excepted.

The author and FXStreet are not registered investment advisors and nothing in this article is intended to be investment advice.

Recommended content


Recommended content

Editors’ Picks

How will US Dollar react to Q1 GDP data? – LIVE

How will US Dollar react to Q1 GDP data? – LIVE

The US' GDP is forecast to grow at an annual rate of 2.5% in the first quarter of the year. The US Dollar struggles to find demand as investors stay on the sidelines, while waiting to assess the impact of the US economic performance on the Fed rate outlook. 

FOLLOW US LIVE

EUR/USD holds gains above 1.0700, as key US data loom

EUR/USD holds gains above 1.0700, as key US data loom

EUR/USD holds gains above 1.0700 in the European session on Thursday. Renewed US Dollar weakness offsets the risk-off market environment, supporting the pair ahead of the key US GDP and PCE inflation data. 

EUR/USD News

GBP/USD extends recovery above 1.2500, awaits US GDP data

GBP/USD extends recovery above 1.2500, awaits US GDP data

GBP/USD is catching a fresh bid wave, rising above 1.2500 in European trading on Thursday. The US Dollar resumes its corrective downside, as traders resort to repositioning ahead of the high-impact US advance GDP data for the first quarter. 

GBP/USD News

Gold price edges higher amid weaker USD and softer risk tone, focus remains on US GDP

Gold price edges higher amid weaker USD and softer risk tone, focus remains on US GDP

Gold price (XAU/USD) attracts some dip-buying in the vicinity of the $2,300 mark on Thursday and for now, seems to have snapped a three-day losing streak, though the upside potential seems limited. 

Gold News

XRP extends its decline, crypto experts comment on Ripple stablecoin and benefits for XRP Ledger

XRP extends its decline, crypto experts comment on Ripple stablecoin and benefits for XRP Ledger

Ripple extends decline to $0.52 on Thursday, wipes out weekly gains. Crypto expert asks Ripple CTO how the stablecoin will benefit the XRP Ledger and native token XRP. 

Read more

Forex MAJORS

Cryptocurrencies

Signatures