|

WTI Price Analisis: WTI consolidates gains after Friday’s rally

  • The WTI price trades with losses near the $73.00 area, cutting a four-day winning streak.
  • Weak NFPs from the US and dovish bets on the Fed made Oil prices rally on Friday.
  • Eyes on inflation data from the US on Wednesday.

At the start of the week, the West Texas Intermediate (WTI) barrel trades with losses as investors take profits after closing a 4.63% weekly gain last Friday. Weak Nonfarm Payrolls (NFP) made investors bet on a less aggressive Federal Reserve, favouring a positive market environment—eyes on crucial Consumer Price Index (CPI) data on Wednesday.

Despite investors betting on a dovish bet amid lower-than-expected NFPs, they should keep an eye on sticky wage inflation as Average Hourly Earning increased in June, higher than the expected figures. In that sense, sticky prices give the Fed reasons to continue hiking so Wednesday's CPI figures will be crucial to give markets a better outlook of the US inflationary situation. As for now, markets are expecting the CPI headline figure to drop to 3.1% YoY in June from 4% and the Core measure to 5% from its previous 5.3%.

It's worth noticing that higher interest rates cools down economic activity and hence lowers Oil demand, pulling down its price, so hawkish bets on the Fed may fuel further downside for the WTI. As for now, the FedWatch tool suggests that a 25 basis point (bps) hike is already priced in for the next July meeting and the probability of another hike in 2023 hovers around 40%.
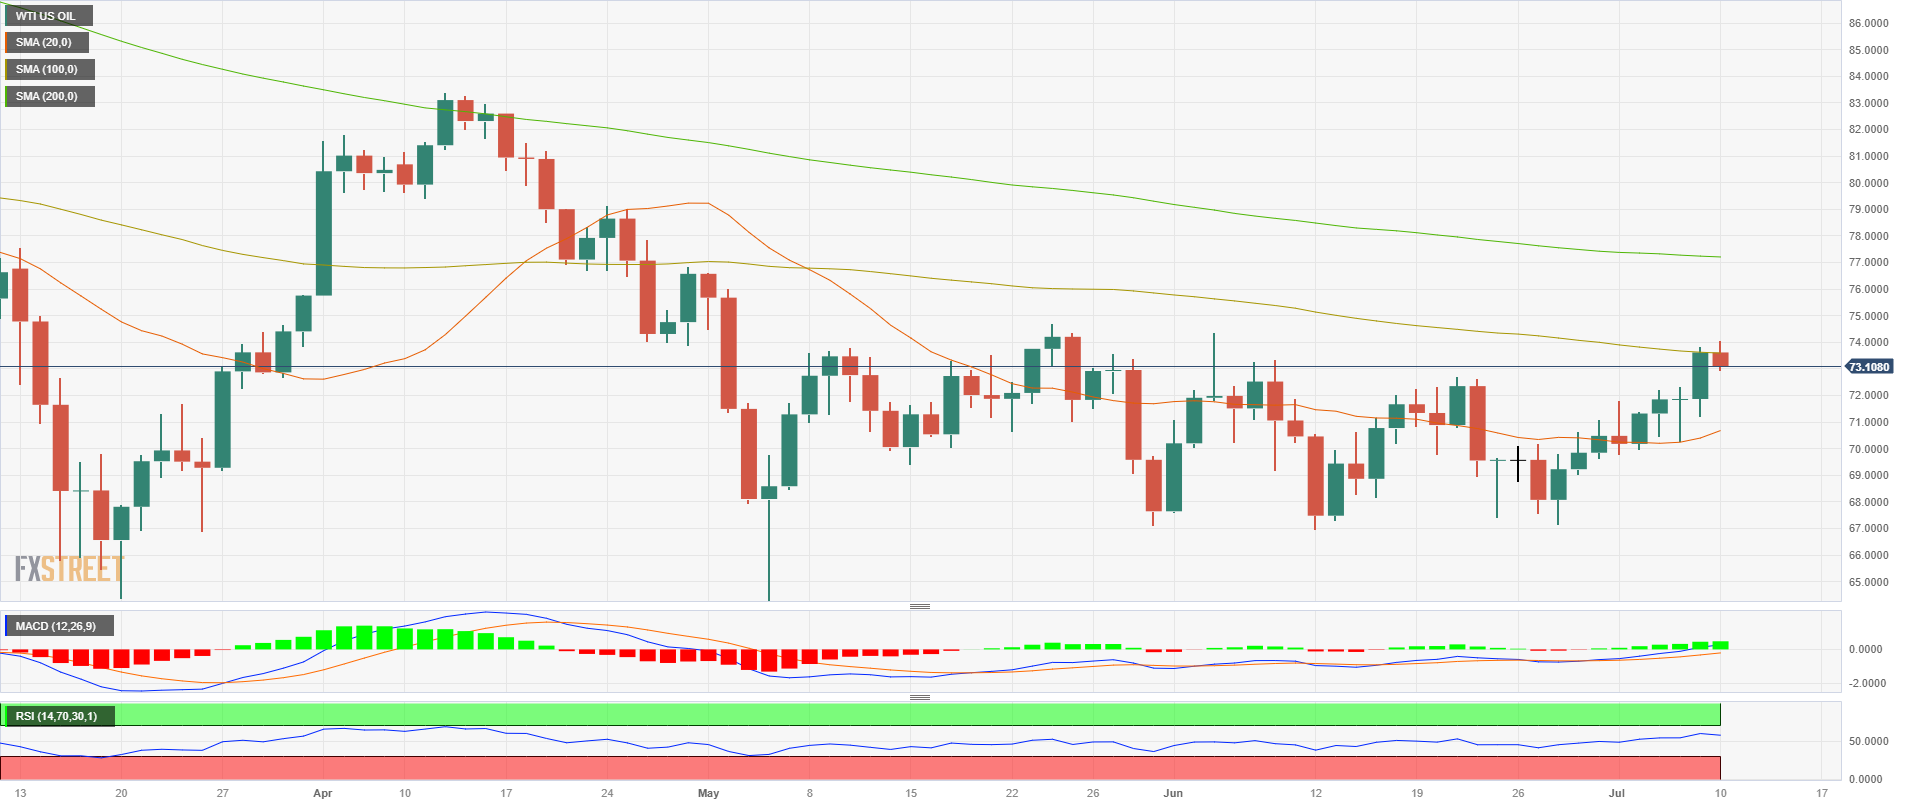
WTI levels to watch

On the daily chart, the technical outlook is neutral to bullish for the WTI. To confirm its positive stance, the bulls must consolidate above the 100-day Simple Moving Average (SMA) at $73.56 which could pave the way for another upwards leg. In addition, the Relative Strength Index (RSI) stands in positive territory, as well as the Moving Average Convergence Divergence (MACD)

Resistance levels: $73.56 (100-day SMA), $76.00,$77.80.
Support levels: $71.90,$70.60(20-day SMA), $69.50.

WTI US OIL

Overview
Today last price73.15
Today Daily Change-0.47
Today Daily Change %-0.64
Today daily open73.62
 
Trends
Daily SMA2070.4
Daily SMA5071.13
Daily SMA10073.63
Daily SMA20077.24
 
Levels
Previous Daily High73.85
Previous Daily Low71.22
Previous Weekly High73.85
Previous Weekly Low69.77
Previous Monthly High74.36
Previous Monthly Low66.95
Daily Fibonacci 38.2%72.84
Daily Fibonacci 61.8%72.22
Daily Pivot Point S171.94
Daily Pivot Point S270.26
Daily Pivot Point S369.31
Daily Pivot Point R174.57
Daily Pivot Point R275.53
Daily Pivot Point R377.21

Author

Patricio Martín

Patricio is an economist from Argentina passionate about global finance and understanding the daily movements of the markets.

More from Patricio Martín
Share:

Markets move fast. We move first.

Orange Juice Newsletter brings you expert driven insights - not headlines. Every day on your inbox.

By subscribing you agree to our Terms and conditions.

Editor's Picks

EUR/USD rebounds after falling toward 1.1700

EUR/USD gains traction and trades above 1.1730 in the American session, looking to end the week virtually unchanged. The bullish opening in Wall Street makes it difficult for the US Dollar to preserve its recovery momentum and helps the pair rebound heading into the weekend.

GBP/USD steadies below 1.3400 as traders assess BoE policy outlook

Following Thursday's volatile session, GBP/USD moves sideways below 1.3400 on Friday. Investors reassess the Bank of England's policy oıtlook after the MPC decided to cut the interest rate by 25 bps by a slim margin. Meanwhile, the improving risk mood helps the pair hold its ground.

Gold stays below $4,350, looks to post small weekly gains

Gold struggles to gather recovery momentum and stays below $4,350 in the second half of the day on Friday, as the benchmark 10-year US Treasury bond yield edges higher. Nevertheless, the precious metal remains on track to end the week with modest gains as markets gear up for the holiday season.

Crypto Today: Bitcoin, Ethereum, XRP rebound amid bearish market conditions

Bitcoin (BTC) is edging higher, trading above $88,000 at the time of writing on Monday. Altcoins, including Ethereum (ETH) and Ripple (XRP), are following in BTC’s footsteps, experiencing relief rebounds following a volatile week.

How much can one month of soft inflation change the Fed’s mind?

One month of softer inflation data is rarely enough to shift Federal Reserve policy on its own, but in a market highly sensitive to every data point, even a single reading can reshape expectations. November’s inflation report offered a welcome sign of cooling price pressures. 

XRP rebounds amid ETF inflows and declining retail demand demand

XRP rebounds as bulls target a short-term breakout above $2.00 on Friday. XRP ETFs record the highest inflow since December 8, signaling growing institutional appetite.