WTI Oil picks up, but is expected to find resistance at $62.00
- WTI Oil prices tick up but remain within previous ranges below $62.00.
- Market expectations of higher supplies are acting as a headwind for rallies.
- The technical picture is showing a lack of clear bias, with prices bouncing in a $3.5 range.

Crude prices are paring losses on Tuesday as the UK and US markets return from a long weekend on an upbeat market mood. Trump’s decision to delay tariffs on European products has eased concerns about severe damage to global growth and to Oil demand by extension. The market is still celebrating the news.
The current recovery, however, is likely to be short-lived, with fears of oversupply looming. A recent report from Goldman Sachs warns that a significant increase by non-OPEC suppliers will send WTI prices to $52 in 2026
WTI Oil technical analysis: Prices wavering without a clear bias
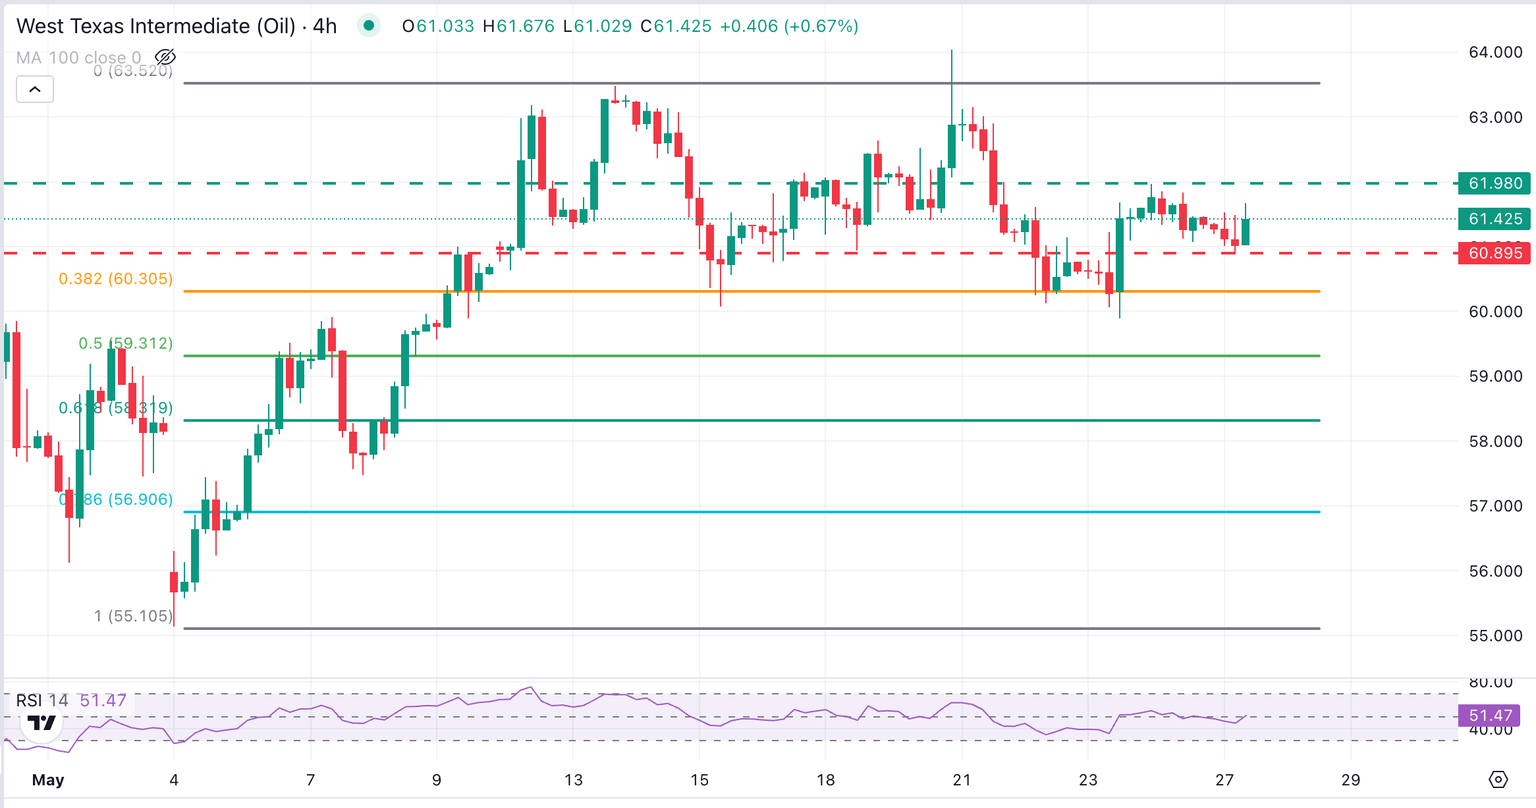
The technical picture shows crude prices looking for direction after the rejection at $63.45 resistance area was contained at the $60.00 psychological level.
The 4-hour RSI is wavering around the 50 line, highlighting a lack of clear momentum, but a bullish engulfing candle on Friday’s daily chart is a positive sign.
The intraday bias shows a mild bullish tone, which is likely to be halted at the $62.00 area, at the May 26 high. Above here, the top of the horizontal channel, at $63.50, would be exposed.
On the downside, supports are at the $61.00 intra-day low ahead of the May 15, 22, and 23 lows, at $60.00.
WTI Oil 4-Hour Chart
WTI Oil FAQs
WTI Oil is a type of Crude Oil sold on international markets. The WTI stands for West Texas Intermediate, one of three major types including Brent and Dubai Crude. WTI is also referred to as “light” and “sweet” because of its relatively low gravity and sulfur content respectively. It is considered a high quality Oil that is easily refined. It is sourced in the United States and distributed via the Cushing hub, which is considered “The Pipeline Crossroads of the World”. It is a benchmark for the Oil market and WTI price is frequently quoted in the media.
Like all assets, supply and demand are the key drivers of WTI Oil price. As such, global growth can be a driver of increased demand and vice versa for weak global growth. Political instability, wars, and sanctions can disrupt supply and impact prices. The decisions of OPEC, a group of major Oil-producing countries, is another key driver of price. The value of the US Dollar influences the price of WTI Crude Oil, since Oil is predominantly traded in US Dollars, thus a weaker US Dollar can make Oil more affordable and vice versa.
The weekly Oil inventory reports published by the American Petroleum Institute (API) and the Energy Information Agency (EIA) impact the price of WTI Oil. Changes in inventories reflect fluctuating supply and demand. If the data shows a drop in inventories it can indicate increased demand, pushing up Oil price. Higher inventories can reflect increased supply, pushing down prices. API’s report is published every Tuesday and EIA’s the day after. Their results are usually similar, falling within 1% of each other 75% of the time. The EIA data is considered more reliable, since it is a government agency.
OPEC (Organization of the Petroleum Exporting Countries) is a group of 12 Oil-producing nations who collectively decide production quotas for member countries at twice-yearly meetings. Their decisions often impact WTI Oil prices. When OPEC decides to lower quotas, it can tighten supply, pushing up Oil prices. When OPEC increases production, it has the opposite effect. OPEC+ refers to an expanded group that includes ten extra non-OPEC members, the most notable of which is Russia.
Author

Guillermo Alcala
FXStreet
Graduated in Communication Sciences at the Universidad del Pais Vasco and Universiteit van Amsterdam, Guillermo has been working as financial news editor and copywriter in diverse Forex-related firms, like FXStreet and Kantox.


