WTI meets a critical weekly resistance area
- Oil prices have rebounded strongly to a marked area of resistance.
- General consumption data doesn't support the demand fears.
Oil prices as measured by West Texas Intermediate (WTI) crude are higher by more than 5.6% at the time of writing as the Wall Street session moves into the final hour of trade.
Improved risk appetite set off an exodus of speculative shorts, providing support despite data showing an unexpected rise in US oil inventories.
Earlier in the day, WTI crude futures rose $3.16, or 4.7%, to $70.36 a barrel, a 4.7% gain.
WTI CFDs spot is back above $70 after rallying from a low of $66.42 to test bearish commitments at $70.50, an area of confluence in resistance.
This was earmarked for a correction in a prior analysis earlier this week, (see below).
The price of oil has rebounded from an 8% drop on Monday that occurred following the announcements of a deal by OPEC+ to boost supply by 400,000 barrels per day from August through December.
The concerns of the Delta variant of the coronavirus in major markets like the United States, Britain and Japan also stripped the market's demand-side bias.
Meanwhile, the rise in US crude stockpiles for the first time since May is something that could hamstring the short covering and correction for the sessions ahead.
Crude inventories rose unexpectedly by 2.1 million barrels last week to 439.7 million barrels, the US Energy Information Administration data showed today. Analysts had expected a 4.5 million-barrel drop.
However, there were positive aspects in the report with strong gasoline demand and a rebound in distillate fuels.
A demand-side and bullish fundamental bias
Looking forward, general end-user data doesn't support the demand fears, according to analysts at TD Securities.
''Road traffic in Asia continues to recover. Air travel is also rising at a fast clip, particularly in Europe, but with the US and China also continuing to post gains. While Chinese purchases of raw materials have slowed of late, strong refinery runs in China highlight that the recovery in energy demand is diverging from that of broad commodities. Most importantly, US drivers continue to fuel the recovery in energy demand, where mobility restrictions may be less likely to take place.''
''While the weakness in crude oil prices can be tied to energy supply risk, after OPEC+ put an end to destructive radio silence, we estimate that the market will remain on a tightening trajectory,'' the analysts argued.
''While global macro concerns may have sparked a sharp reprice, OPEC's agreement is still creating a constructive set-up for crude prices.''
WTI technical analysis
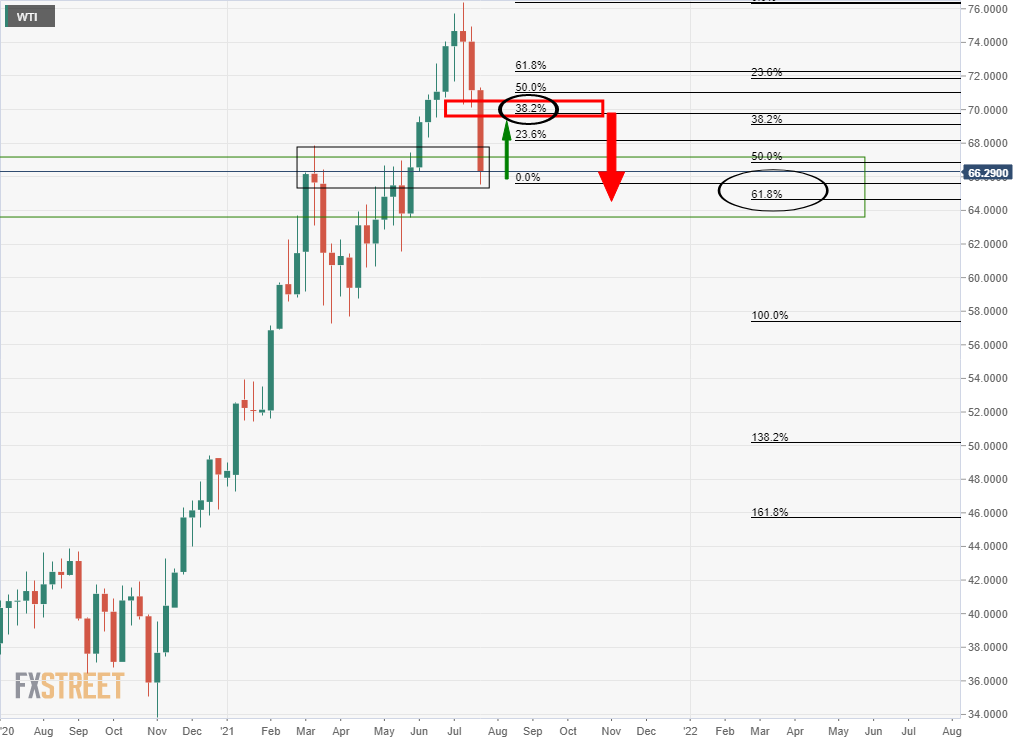
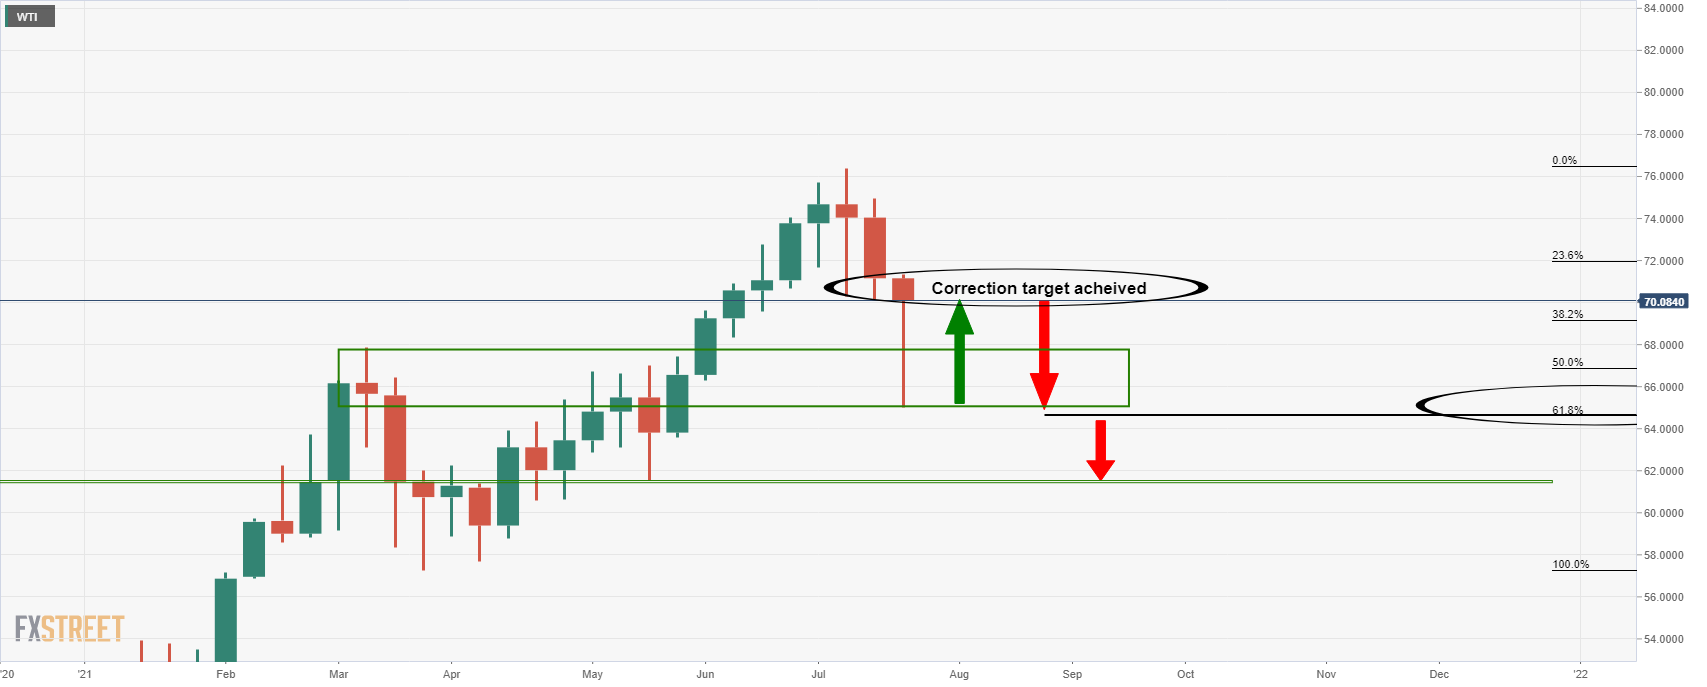
As per the prior analysis, WTI keeps falling, fundas remain bearish, short-term, which refers to a series of previous analyses starting on the 15 July, WTI prints fresh lows within bearish daily structure, and in this week's, Chart of the Week: WTI on the verge of significant decline? the price has gone according to the forecasts on the nose, catching both the downside and upside correction.
Prior analysis, the correction
''At this juncture, an upside correction would be expected in a period of accumulation that could eventuate into a medium-term bullish structure.''
Live market
Meanwhile, there are now technical prospects of a retest of the downside that is in contrast to the bullish demand-side fundamental data.
The monthly 61.8% Fibonacci retracement in the 64.50/60s support area si compelling on a break of $65 the figure (as illustrated above and below):
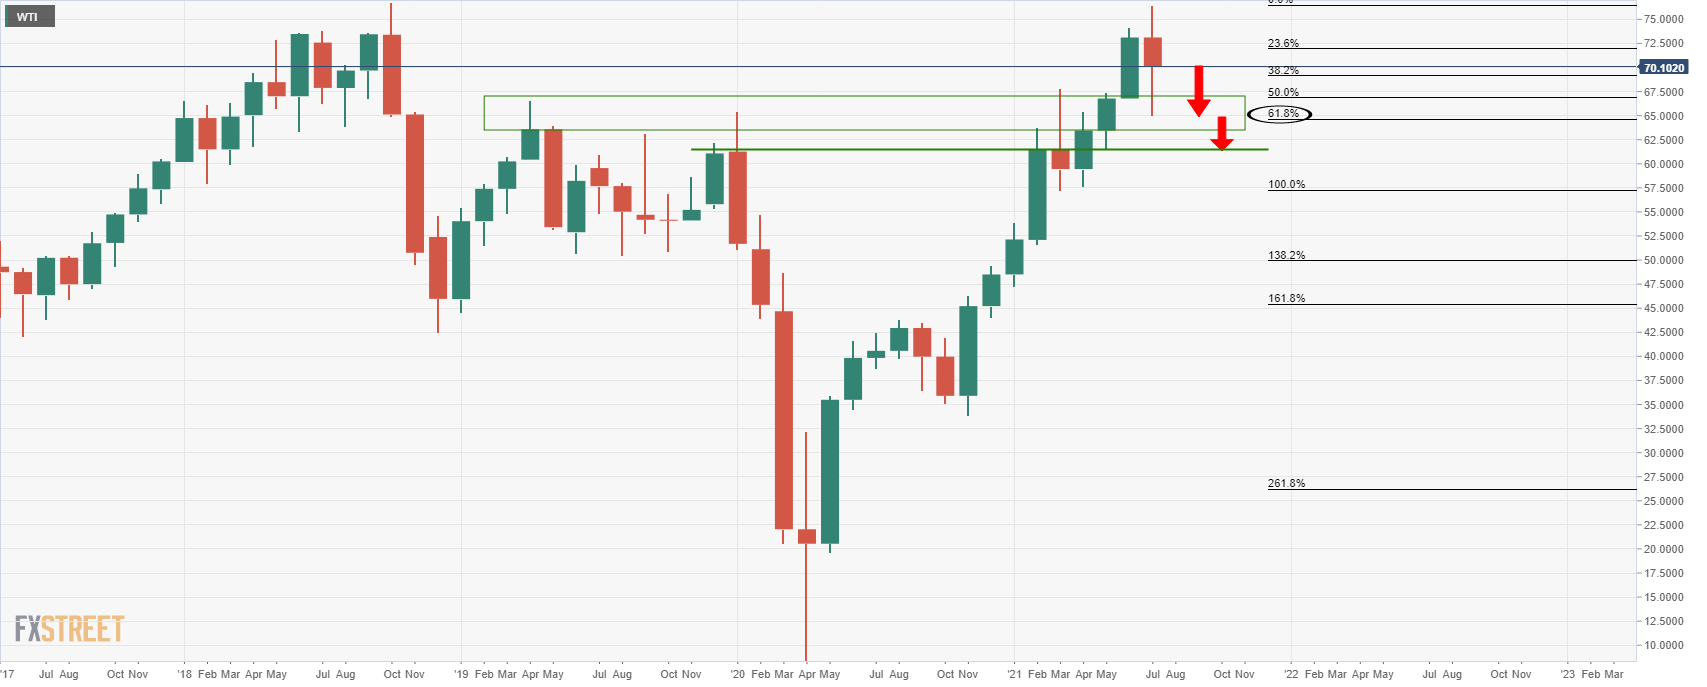
Below there, the 61.50s will be eyed.
Author

Ross J Burland
FXStreet
Ross J Burland, born in England, UK, is a sportsman at heart. He played Rugby and Judo for his county, Kent and the South East of England Rugby team.


