|

Chart of the Week: WTI on the verge of significant decline?

  • WTI bears are stepping in at monthly resistance, and a downtrend is expected.
  • A retest of daily resistance could be on the cards first. 

The price of oil is retreating from cycle highs with a number of bearish fundamentals in play. 

From a technical perspective, the price is stacking up to be considerably bearish as follows:

Monthly chart

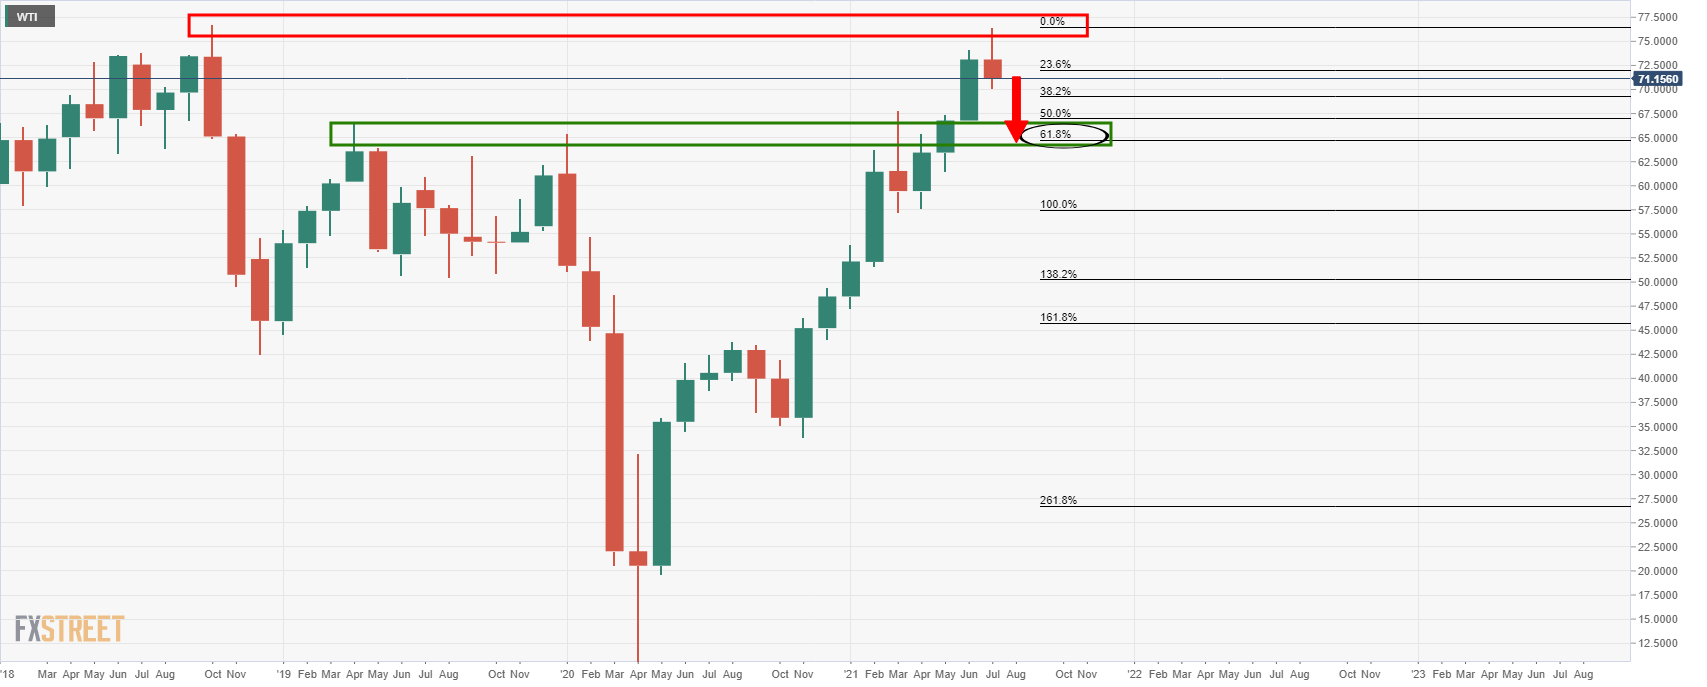
The monthly chart is showing that the price has met resistance and is being rejected. 

Bulls are taking profits, and this could lead to a significant sell-off to the prior resistance that meets the 50% mean reversion and the 61.8% Fibonacci levels between $67.10 and $64.80. 

Weekly chart

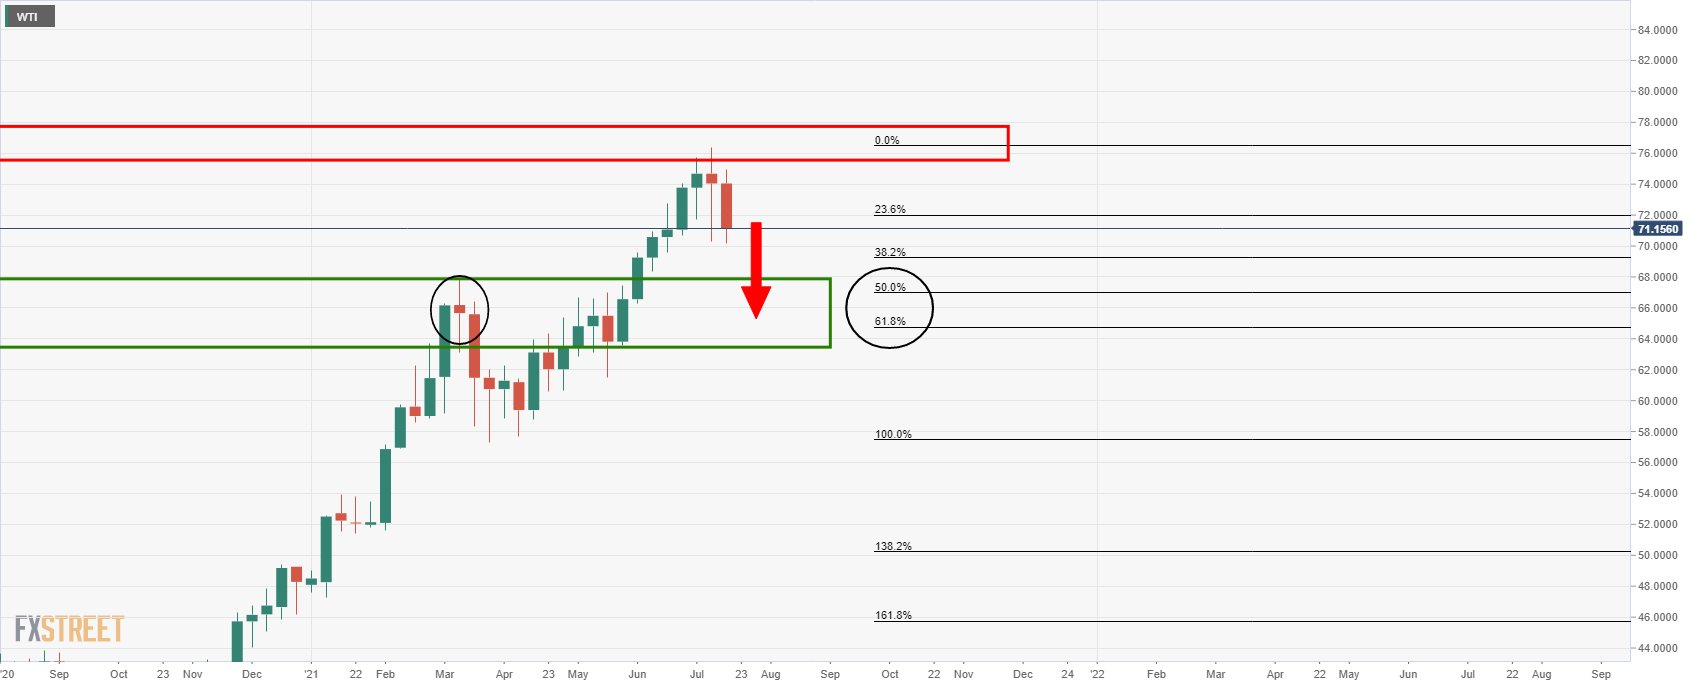
The weekly chart shows this more clearly within the range of the mid-March weekly candle. 

Daily chart

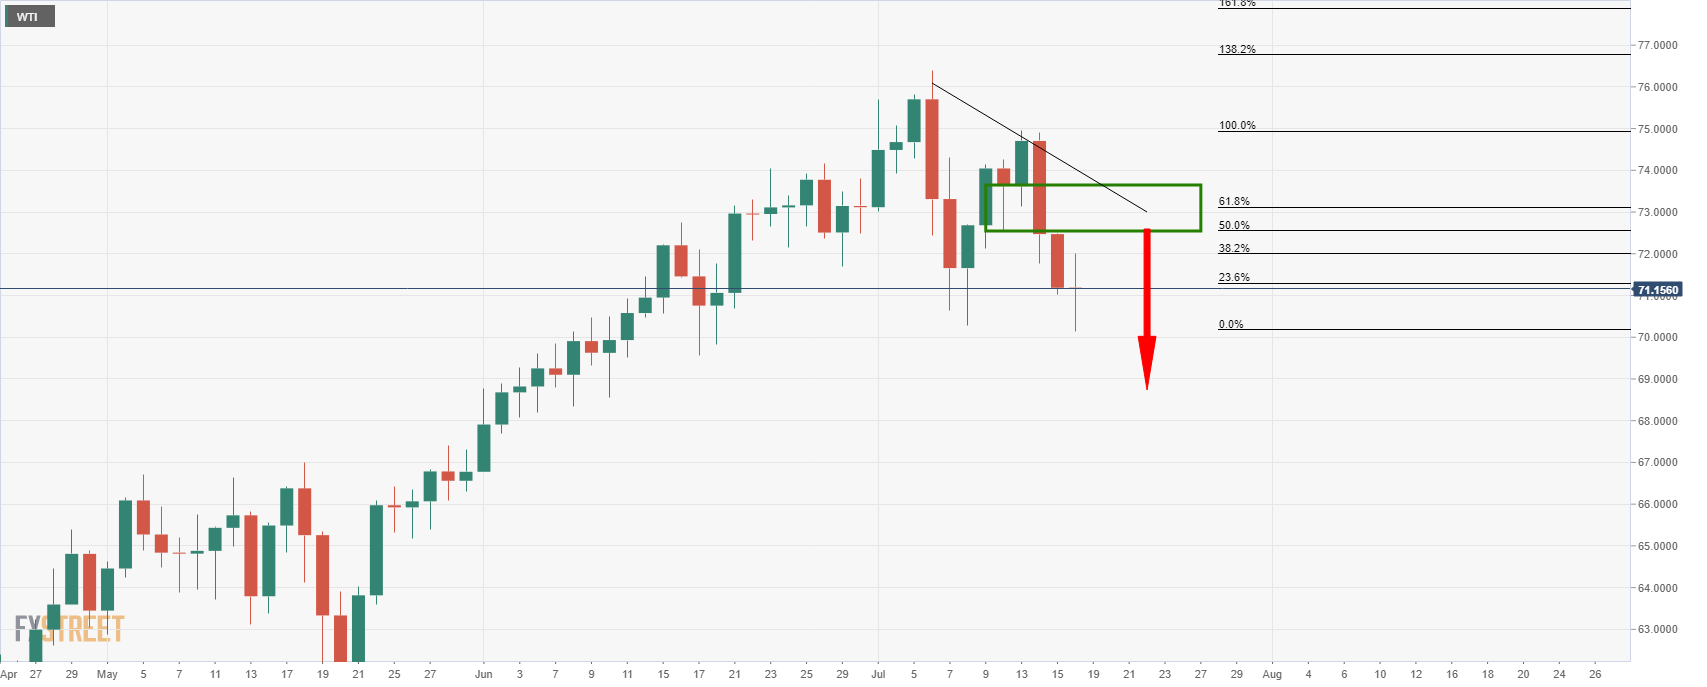
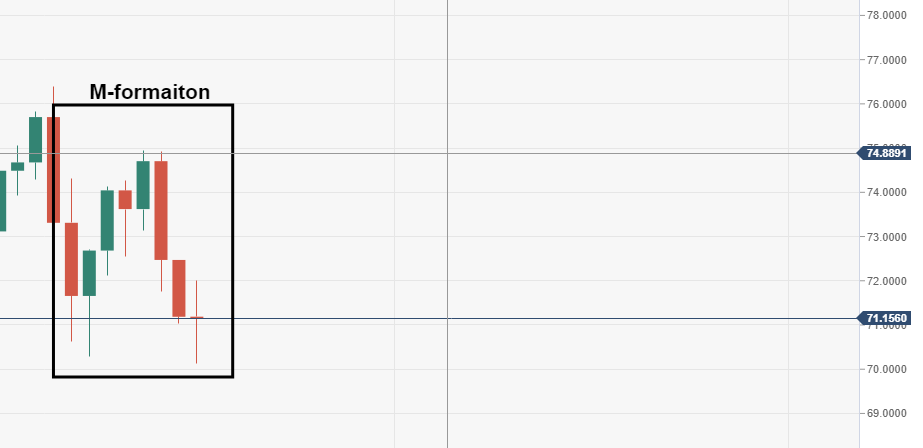
Meanwhile, from a daily perspective, the price would be expected to retest the prior lows in the $72.50s considering the M-formation:

The lows also have a confluence with the 50% mean reversion of the current bearish impulse:

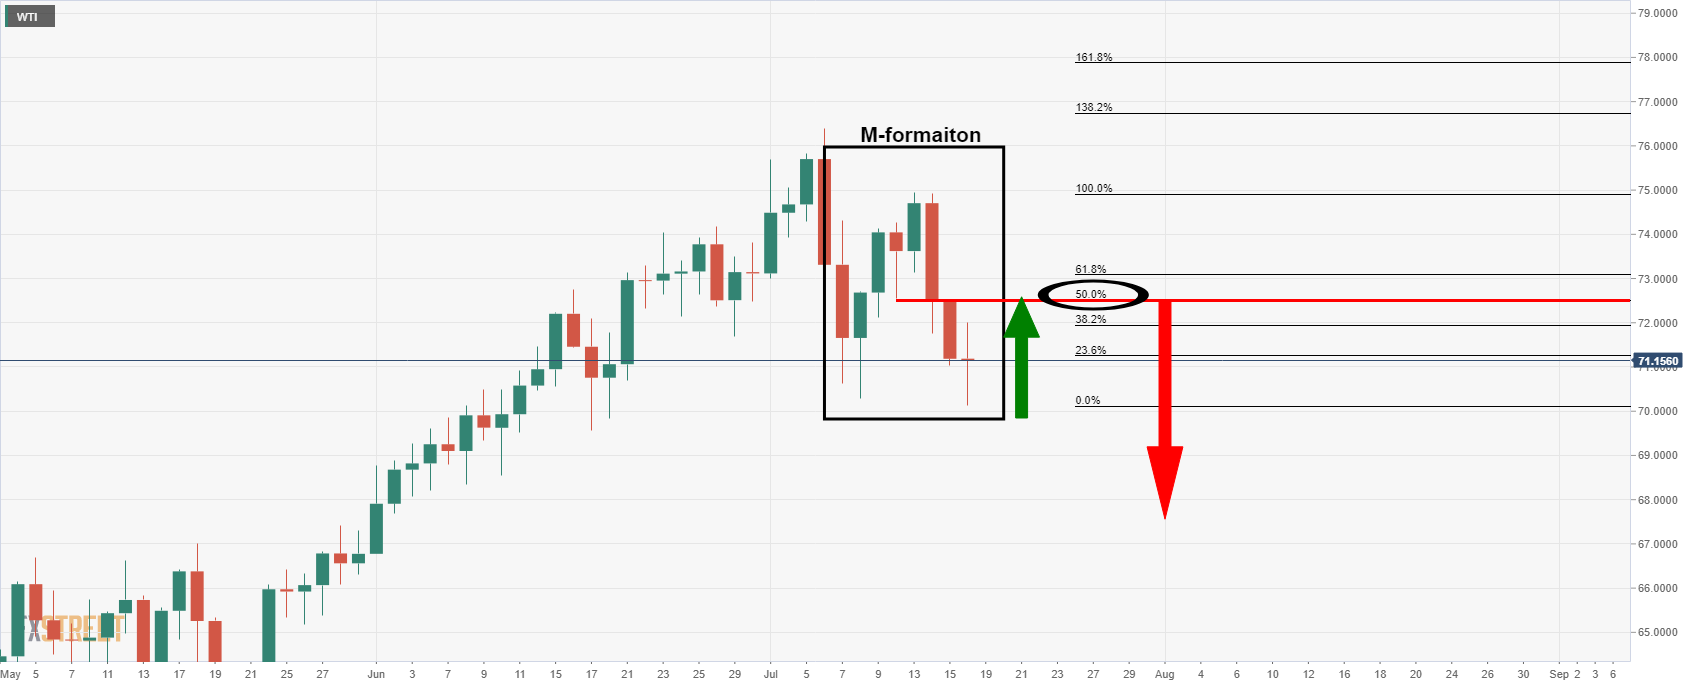
This area would, therefore, be expected to act as a strong level of resistance and lead to an onward downside continuation in the coming week:

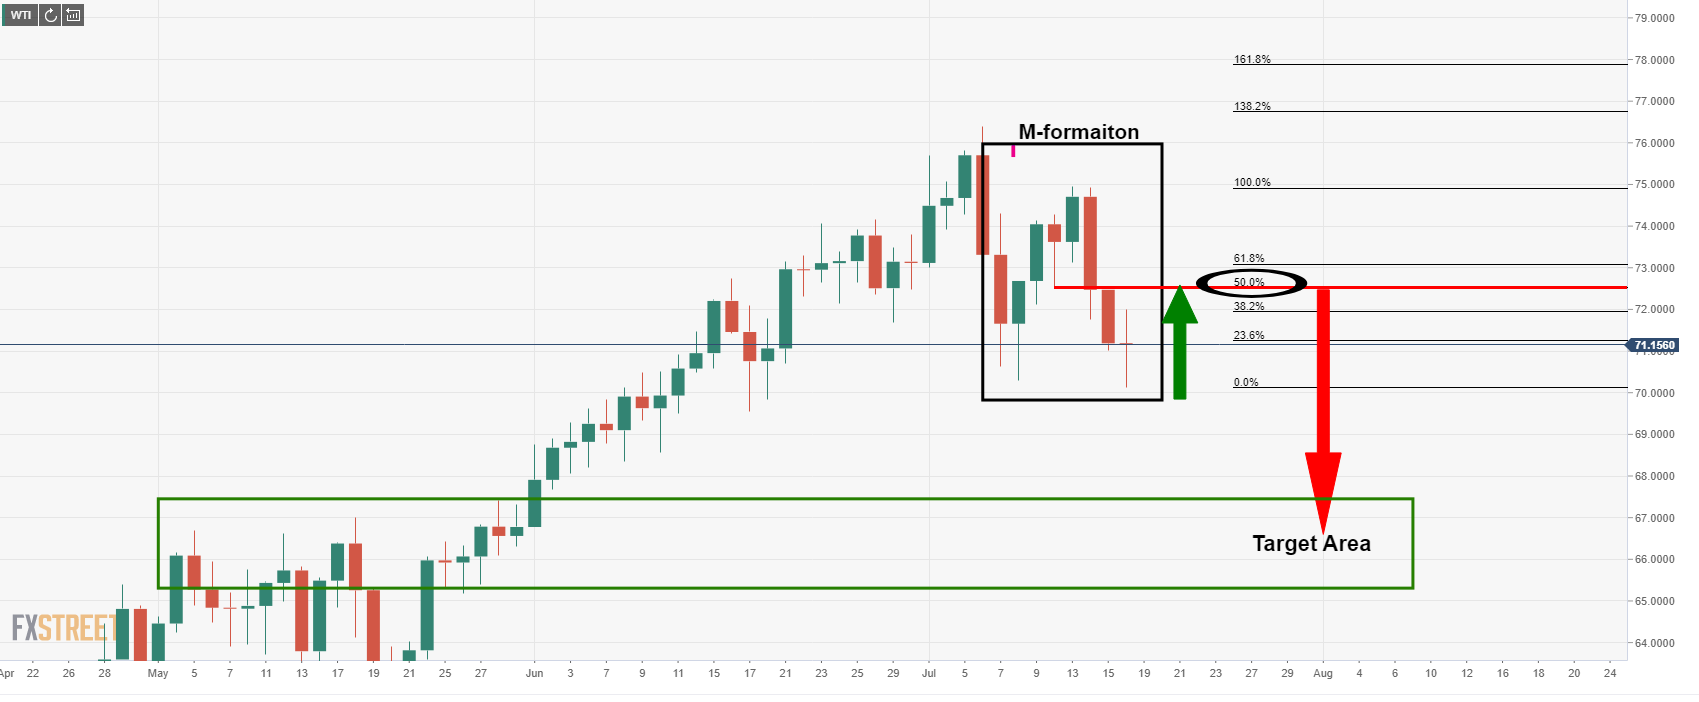
The targetted area is between the $67.50s and $65.30s. 

Premium

You have reached your limit of 3 free articles for this month.

Start your subscription and get access to all our original articles.

Subscribe to PremiumSign In

Author

Ross J Burland

Ross J Burland, born in England, UK, is a sportsman at heart. He played Rugby and Judo for his county, Kent and the South East of England Rugby team.

More from Ross J Burland
Share:

Markets move fast. We move first.

Orange Juice Newsletter brings you expert driven insights - not headlines. Every day on your inbox.

By subscribing you agree to our Terms and conditions.

Editor's Picks

EUR/USD clings to small gains near 1.1750

Following a short-lasting correction in the early European session, EUR/USD regains its traction and clings to moderate gains at around 1.1750 on Monday. Nevertheless, the pair's volatility remains low, with investors awaiting this weeks key data releases from the US and the ECB policy announcements.

GBP/USD edges higher toward 1.3400 ahead of US data and BoE

GBP/USD reverses its direction and advances toward 1.3400 following a drop to the 1.3350 area earlier in the day. The US Dollar struggles to gather recovery momentum as markets await Tuesday's Nonfarm Payrolls data, while the Pound Sterling holds steady ahead of the BoE policy announcements later in the week.

Gold stuck around $4,300 as markets turn cautious

Gold loses its bullish momentum and retreats below $4,350 after testing this level earlier on Monday. XAU/USD, however, stays in positive territory as the US Dollar remains on the back foot on growing expectations for a dovish Fed policy outlook next year.

Solana consolidates as spot ETF inflows near $1 billion signal institutional dip-buying

Solana price hovers above $131 at the time of writing on Monday, nearing the upper boundary of a falling wedge pattern, awaiting a decisive breakout. On the institutional side, demand for spot Solana Exchange-Traded Funds remained firm, pushing total assets under management to nearly $1 billion since launch. 

Big week ends with big doubts

The S&P 500 continued to push higher yesterday as the US 2-year yield wavered around the 3.50% mark following a Federal Reserve (Fed) rate cut earlier this week that was ultimately perceived as not that hawkish after all. The cut is especially boosting the non-tech pockets of the market.

Solana Price Forecast: SOL consolidates as spot ETF inflows near $1 billion signal institutional dip-buying

Solana (SOL) price hovers above $131 at the time of writing on Monday, nearing the upper boundary of a falling wedge pattern, awaiting a decisive breakout.