- Prices of the WTI stay consolidative below the $24.00 mark.
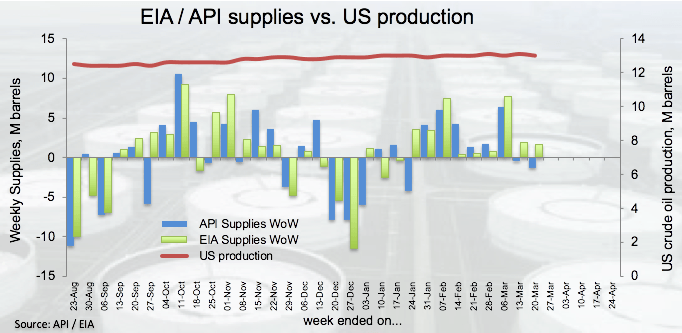
- The EIA reported a 1.6M barrel build during last week.
- Crude oil stays under pressure despite US, Fed stimulus packages.
Prices of the West Texas Intermediate are prolonging the weekly consolidation, navigating the sub-$24.00 region at the time of writing.
WTI looks to supply, demand for direction
The barrel of WTI is adding to Wednesday’s losses in the sub-$24.00 region, as traders keep ignoring the recently announced stimulus measures by the Federal Reserve and the US government.
Instead, the focus of attention in the oil market stays unchanged around the Russia-Saudi Arabia price war (on the supply side) and the predicted significant impact on the oil industry from the coronavirus fallout (on the demand side).
Also collaborating with the sour sentiment around oil, the EIA reported US crude oil inventories went up – albeit less than forecasted – by more than 1.6M barrels during last week and the US oil output ebbed a tad to around 13M barrels.
Moving forward, the next release on the calendar will be Friday’s usual report on the US drilling activity by Baker Hughes.
What to look for around WTI
Crude oil prices remain under heavy pressure in a context of heightened volatility and thin liquidity. As usual in the past weeks, prices of the commodity are hurt by a combination of demand and supply side drivers coming from the ongoing (and future) impact of the coronavirus on the global economy and the unabated Saudi Arabia-Russia price war, aggravated by the palpable possibility that the Kingdom could ramp up production to a record of 12.3Mbpd as soon as in April. A potential relief to this low-prices-scenario could come in the form of a US intervention, which is expected to morph into some sort of agreement between the US, Russia and Saudi Arabia, all aimed to bring in stabilization to the oil market.
WTI significant levels
At the moment the barrel of WTI is retreating 2.39% at $23.41 and a breach of $20.08 (2020 low Mar.18) would expose $17.12 (monthly low November 2001) and finally $10.65 (monthly low December 1998). On the upside, the next resistance aligns at $28.46 (high Mar.20) seconded by $33.70 (21-day SMA) and then $36.28 (high Mar.11).
Information on these pages contains forward-looking statements that involve risks and uncertainties. Markets and instruments profiled on this page are for informational purposes only and should not in any way come across as a recommendation to buy or sell in these assets. You should do your own thorough research before making any investment decisions. FXStreet does not in any way guarantee that this information is free from mistakes, errors, or material misstatements. It also does not guarantee that this information is of a timely nature. Investing in Open Markets involves a great deal of risk, including the loss of all or a portion of your investment, as well as emotional distress. All risks, losses and costs associated with investing, including total loss of principal, are your responsibility. The views and opinions expressed in this article are those of the authors and do not necessarily reflect the official policy or position of FXStreet nor its advertisers. The author will not be held responsible for information that is found at the end of links posted on this page.
If not otherwise explicitly mentioned in the body of the article, at the time of writing, the author has no position in any stock mentioned in this article and no business relationship with any company mentioned. The author has not received compensation for writing this article, other than from FXStreet.
FXStreet and the author do not provide personalized recommendations. The author makes no representations as to the accuracy, completeness, or suitability of this information. FXStreet and the author will not be liable for any errors, omissions or any losses, injuries or damages arising from this information and its display or use. Errors and omissions excepted.
The author and FXStreet are not registered investment advisors and nothing in this article is intended to be investment advice.
Recommended content
Editors’ Picks
USD/JPY holds positive ground around 151.50 following Japanese CPI data
The USD/JPY pair holds positive ground for the second consecutive day near 151.45 on Friday during the early Asian trading hours. The cautious approach from the Bank of Japan to keep monetary conditions accommodative exerts some selling pressure on the Japanese Yen.
AUD/USD holds above 0.6500 in thin trading
The Australian Dollar managed to recover ground against its American rival after AUD/USD fell to 0.6484. The upbeat tone of Wall Street underpinned the Aussie despite broad US Dollar strength and tepid Australian data.
Gold price finishes Thursday’s session set to reach new all-time highs
Gold price rallied during the North American session on Thursday and hit a new all-time high of $2,225 in the mid-North American session. Precious metal prices are trending higher even though US Treasury yields are advancing, underpinning the Greenback.
Top 3 Price Prediction BTC, ETH, XRP: Retail watches from the sidelines with a bias for shorts
Bitcoin is showing strength as markets head into the Easter holidays. As it rises, altcoins are following suit, with Ethereum and Ripple posting almost similar gains. Meanwhile, there remains an unfilled CME Gap, with a lot of liquidity also resting above and below BTC price.
Bears have been standing before a steamroller so far this year
Despite a pushback on rate cuts from Christopher Waller, and what was supposed to be cautious trading sentiment ahead of critical US inflation data released later on Friday, the S&P 500 rose on Thursday, marking its best first-quarter performance in five years.