WTI Crude Oil drops to four-month low as OPEC+ supply fears weigh
- WTI extends losses for a fifth straight day, sliding to its lowest level since late May.
- Speculation builds that OPEC+ may approve additional output increases.
- The Technical outlook remains bearish, with WTI slipping below key support and momentum indicators signaling further downside.

West Texas Intermediate (WTI) Crude Oil comes under heavy selling pressure on Thursday, sliding to a four-month low with prices down over 2.0% at the time of writing. The US benchmark is trading around $60.33, extending losses for the fifth straight day after peaking at $66.19 last Friday, the highest level since August 4.
The selloff is being driven by growing concerns over a supply glut, with expectations that the Organization of the Petroleum Exporting Countries and allies (OPEC+) may approve additional output increases at its upcoming meeting. Reports that Saudi Arabia could lift production to defend market share have intensified bearish sentiment, keeping upward momentum firmly capped.
Meanwhile, the latest Energy Information Administration (EIA) report revealed larger-than-expected builds in US crude and fuel inventories, reinforcing worries that demand is softening even as supply climbs.
On the demand side, macroeconomic headwinds are weighing heavily on sentiment. Sluggish industrial activity in China, uncertainty surrounding the United States (US) government shutdown, and broad signs of weaker global growth are dampening the outlook for Oil consumption.
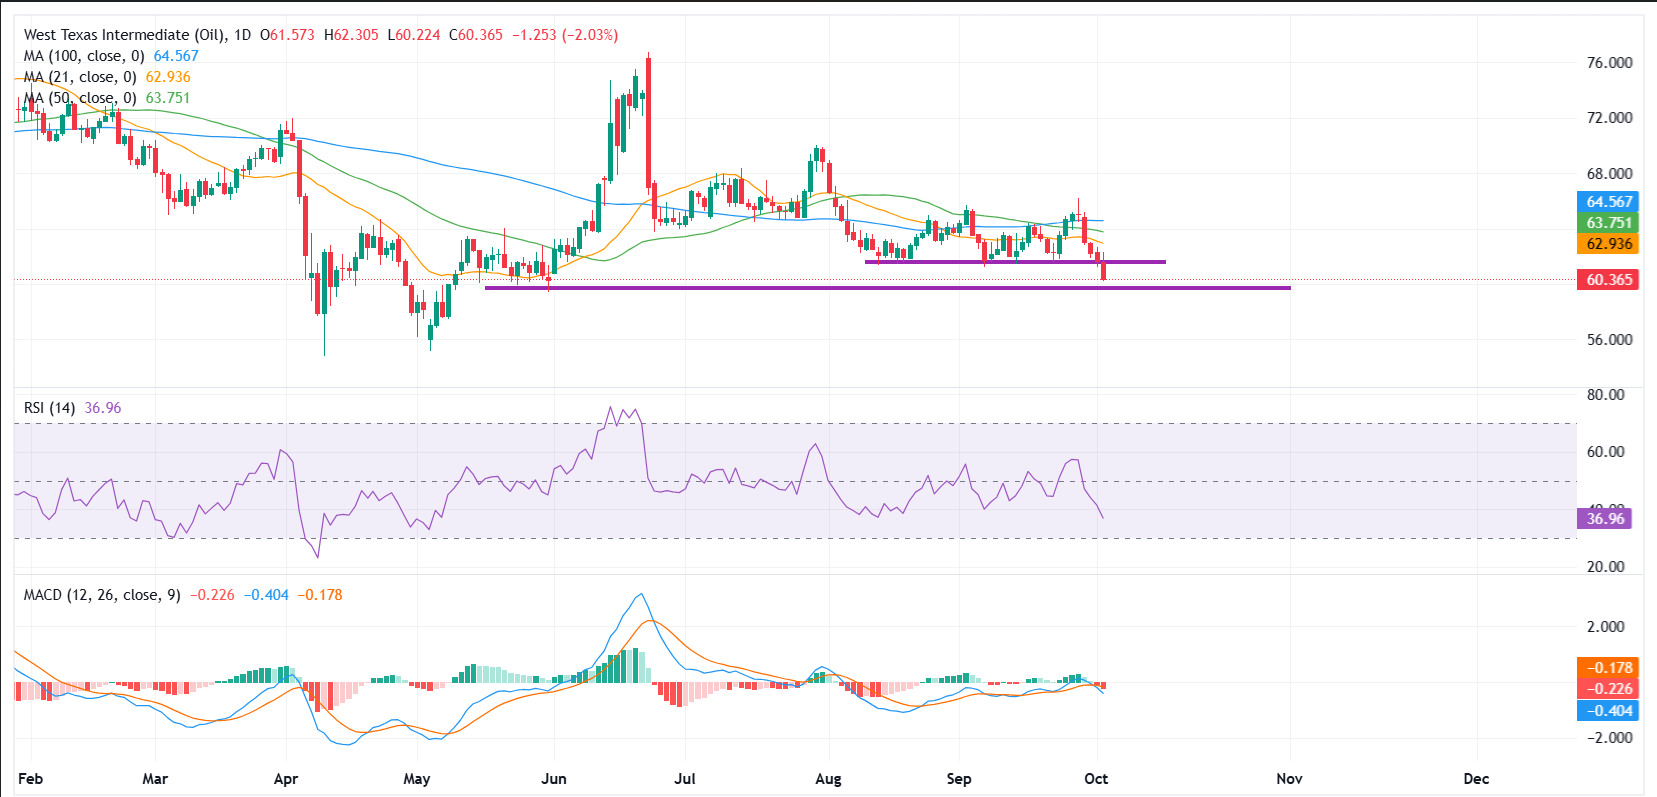
From a technical perspective, WTI has slipped below the key $61.50 support zone that had held firm since early August. The commodity now trades beneath the 21, 50 and 100-day Simple Moving Averages (SMAs), reinforcing the bearish structure on the daily chart.
The next line of defense is seen near $59.50, which aligns closely with the May 30 swing low at $59.39. A break below this level could open the door toward the May 8 trough at $57.47.
On the upside, $61.50 now acts as immediate resistance, and a daily close back above this barrier is required to signal a potential bullish revival. Even then, a cluster of moving averages around $63.00-64.50 is likely to cap recoveries, keeping the broader bias tilted to the downside.
Momentum indicators echo the bearish outlook. The Relative Strength Index (RSI) hovers near 37, edging closer to oversold territory. At the same time, the Moving Average Convergence Divergence (MACD) shows a bearish crossover below the zero line, underscoring weakening momentum and confirming that sellers remain in control.
WTI Oil FAQs
WTI Oil is a type of Crude Oil sold on international markets. The WTI stands for West Texas Intermediate, one of three major types including Brent and Dubai Crude. WTI is also referred to as “light” and “sweet” because of its relatively low gravity and sulfur content respectively. It is considered a high quality Oil that is easily refined. It is sourced in the United States and distributed via the Cushing hub, which is considered “The Pipeline Crossroads of the World”. It is a benchmark for the Oil market and WTI price is frequently quoted in the media.
Like all assets, supply and demand are the key drivers of WTI Oil price. As such, global growth can be a driver of increased demand and vice versa for weak global growth. Political instability, wars, and sanctions can disrupt supply and impact prices. The decisions of OPEC, a group of major Oil-producing countries, is another key driver of price. The value of the US Dollar influences the price of WTI Crude Oil, since Oil is predominantly traded in US Dollars, thus a weaker US Dollar can make Oil more affordable and vice versa.
The weekly Oil inventory reports published by the American Petroleum Institute (API) and the Energy Information Agency (EIA) impact the price of WTI Oil. Changes in inventories reflect fluctuating supply and demand. If the data shows a drop in inventories it can indicate increased demand, pushing up Oil price. Higher inventories can reflect increased supply, pushing down prices. API’s report is published every Tuesday and EIA’s the day after. Their results are usually similar, falling within 1% of each other 75% of the time. The EIA data is considered more reliable, since it is a government agency.
OPEC (Organization of the Petroleum Exporting Countries) is a group of 12 Oil-producing nations who collectively decide production quotas for member countries at twice-yearly meetings. Their decisions often impact WTI Oil prices. When OPEC decides to lower quotas, it can tighten supply, pushing up Oil prices. When OPEC increases production, it has the opposite effect. OPEC+ refers to an expanded group that includes ten extra non-OPEC members, the most notable of which is Russia.
Author

Vishal Chaturvedi
FXStreet
I am a macro-focused research analyst with over four years of experience covering forex and commodities market. I enjoy breaking down complex economic trends and turning them into clear, actionable insights that help traders stay ahead of the curve.


