WTI Crude Oil drops over 2% as trade tensions and tariff threats escalate
- WTI Crude Oil falls over 2% amid tariff threats and rising trade tensions.
- President Trump threatens additional sanctions against Russia, with a 50-day deadline for peace talks with Ukraine.
- WTI nears psychological support at $66.00 with triangle resistance firming at $68.00.

WTI Crude Oil is falling sharply on Monday, as escalating trade disputes and warnings against Russia weigh on sentiment.
At the time of writing, West Texas Intermediate (WTI) has lost over 2% of its recent gains, with the price nearing $66.00.
Over the weekend, US President Donald Trump threatened a 30% blanket tariff on imports from the European Union and Mexico, scheduled to take effect on August 1.
These measures have revived concerns over slowing global trade and energy demand.
In a separate development, President Trump delivered a warning to Russia during a joint press briefing with NATO Secretary-General Mark Rutte in the Oval Office on Monday.
Trump announced a 50-day deadline for Russia to reach a ceasefire agreement with Ukraine. Should Moscow fail to comply, he vowed that the United States would impose "very severe secondary tariffs," including a 100% levy on Russian goods.
“We’re going to be doing very severe tariffs if we don’t have a deal in 50 days — tariffs at about 100 percent, you’d call them secondary,” Trump said. “It’s great for settling wars.”
These remarks, covered by Bloomberg, add to the complex geopolitical landscape already influencing Oil markets.
The WTI Crude Oil daily chart shows that prices have recently pulled back after failing to hold above the 200-day Simple Moving Average (SMA) resistance of $68.00.
Price action is currently trading above the psychological support level of $66.14, with the 50% Fibonacci retracement level of the January-April decline providing resistance at $67.08.
The 50-day and 100-day SMAs are providing additional support at $64.59 and $64.87, respectively. Price action is coiling within a symmetrical triangle, indicating a buildup for a potential breakout.
WTI Crude Oil daily chart
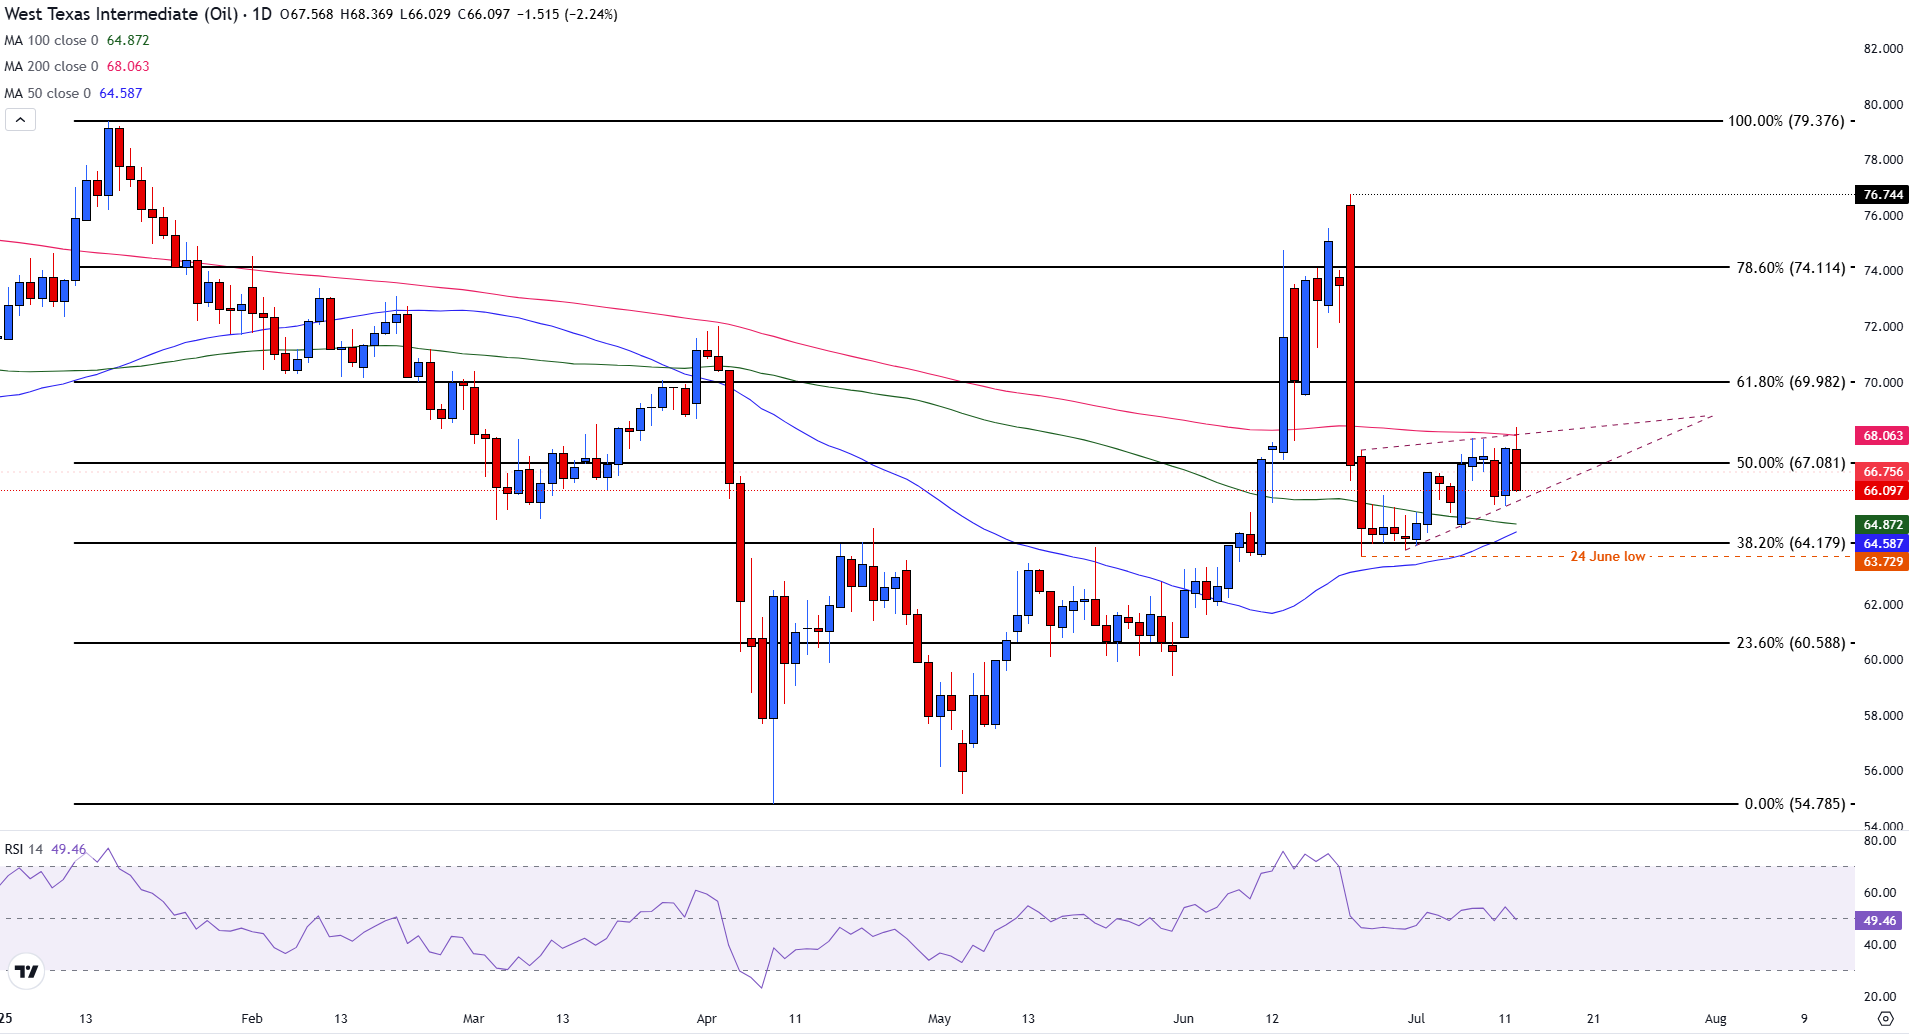
However, the Relative Strength Index (RSI) is neutral near 50, showing a lack of momentum in either direction.
A decisive move below the triangle could expose the June 24 low at $63.73.
On the other hand, a break above $67.08 and the 200-day SMA at $68.06 would be needed to shift the bias back to bullish. For now, the setup leans neutral with a slight bearish tilt following the recent rejection.
WTI Oil FAQs
WTI Oil is a type of Crude Oil sold on international markets. The WTI stands for West Texas Intermediate, one of three major types including Brent and Dubai Crude. WTI is also referred to as “light” and “sweet” because of its relatively low gravity and sulfur content respectively. It is considered a high quality Oil that is easily refined. It is sourced in the United States and distributed via the Cushing hub, which is considered “The Pipeline Crossroads of the World”. It is a benchmark for the Oil market and WTI price is frequently quoted in the media.
Like all assets, supply and demand are the key drivers of WTI Oil price. As such, global growth can be a driver of increased demand and vice versa for weak global growth. Political instability, wars, and sanctions can disrupt supply and impact prices. The decisions of OPEC, a group of major Oil-producing countries, is another key driver of price. The value of the US Dollar influences the price of WTI Crude Oil, since Oil is predominantly traded in US Dollars, thus a weaker US Dollar can make Oil more affordable and vice versa.
The weekly Oil inventory reports published by the American Petroleum Institute (API) and the Energy Information Agency (EIA) impact the price of WTI Oil. Changes in inventories reflect fluctuating supply and demand. If the data shows a drop in inventories it can indicate increased demand, pushing up Oil price. Higher inventories can reflect increased supply, pushing down prices. API’s report is published every Tuesday and EIA’s the day after. Their results are usually similar, falling within 1% of each other 75% of the time. The EIA data is considered more reliable, since it is a government agency.
OPEC (Organization of the Petroleum Exporting Countries) is a group of 12 Oil-producing nations who collectively decide production quotas for member countries at twice-yearly meetings. Their decisions often impact WTI Oil prices. When OPEC decides to lower quotas, it can tighten supply, pushing up Oil prices. When OPEC increases production, it has the opposite effect. OPEC+ refers to an expanded group that includes ten extra non-OPEC members, the most notable of which is Russia.
Author

Tammy Da Costa, CFTe®
FXStreet
Tammy is an economist and market analyst with a deep passion for financial markets, particularly commodities and geopolitics.


