WTI Crude Oil consolidates between key levels as traders await economic cues
- WTI remains range-bound with prices trading between the 20 and 50-day SMAs.
- Oil holds above $62, but a break lower could spark a drop toward $60.
- Momentum stalls as traders await direction from broader market catalysts.

Crude Oil prices remain under pressure on Tuesday, weighed by a combination of rising global supply and persistent economic uncertainty.
West Texas Intermediate (WTI), the United States (US) crude oil benchmark sourced from Texas and surrounding regions, currently remains subdued, trading within a narrow range of technical confluence as it struggles to recover from the broader downtrend that commenced following the January inauguration of US President Donald Trump.
Although prices are relatively stable on Tuesday, prevailing macroeconomic headwinds and continued supply-side pressures are curbing bullish momentum and maintaining a cautious tone across the energy markets.
WTI Crude Oil trades in a tight range as the market awaits fresh drivers
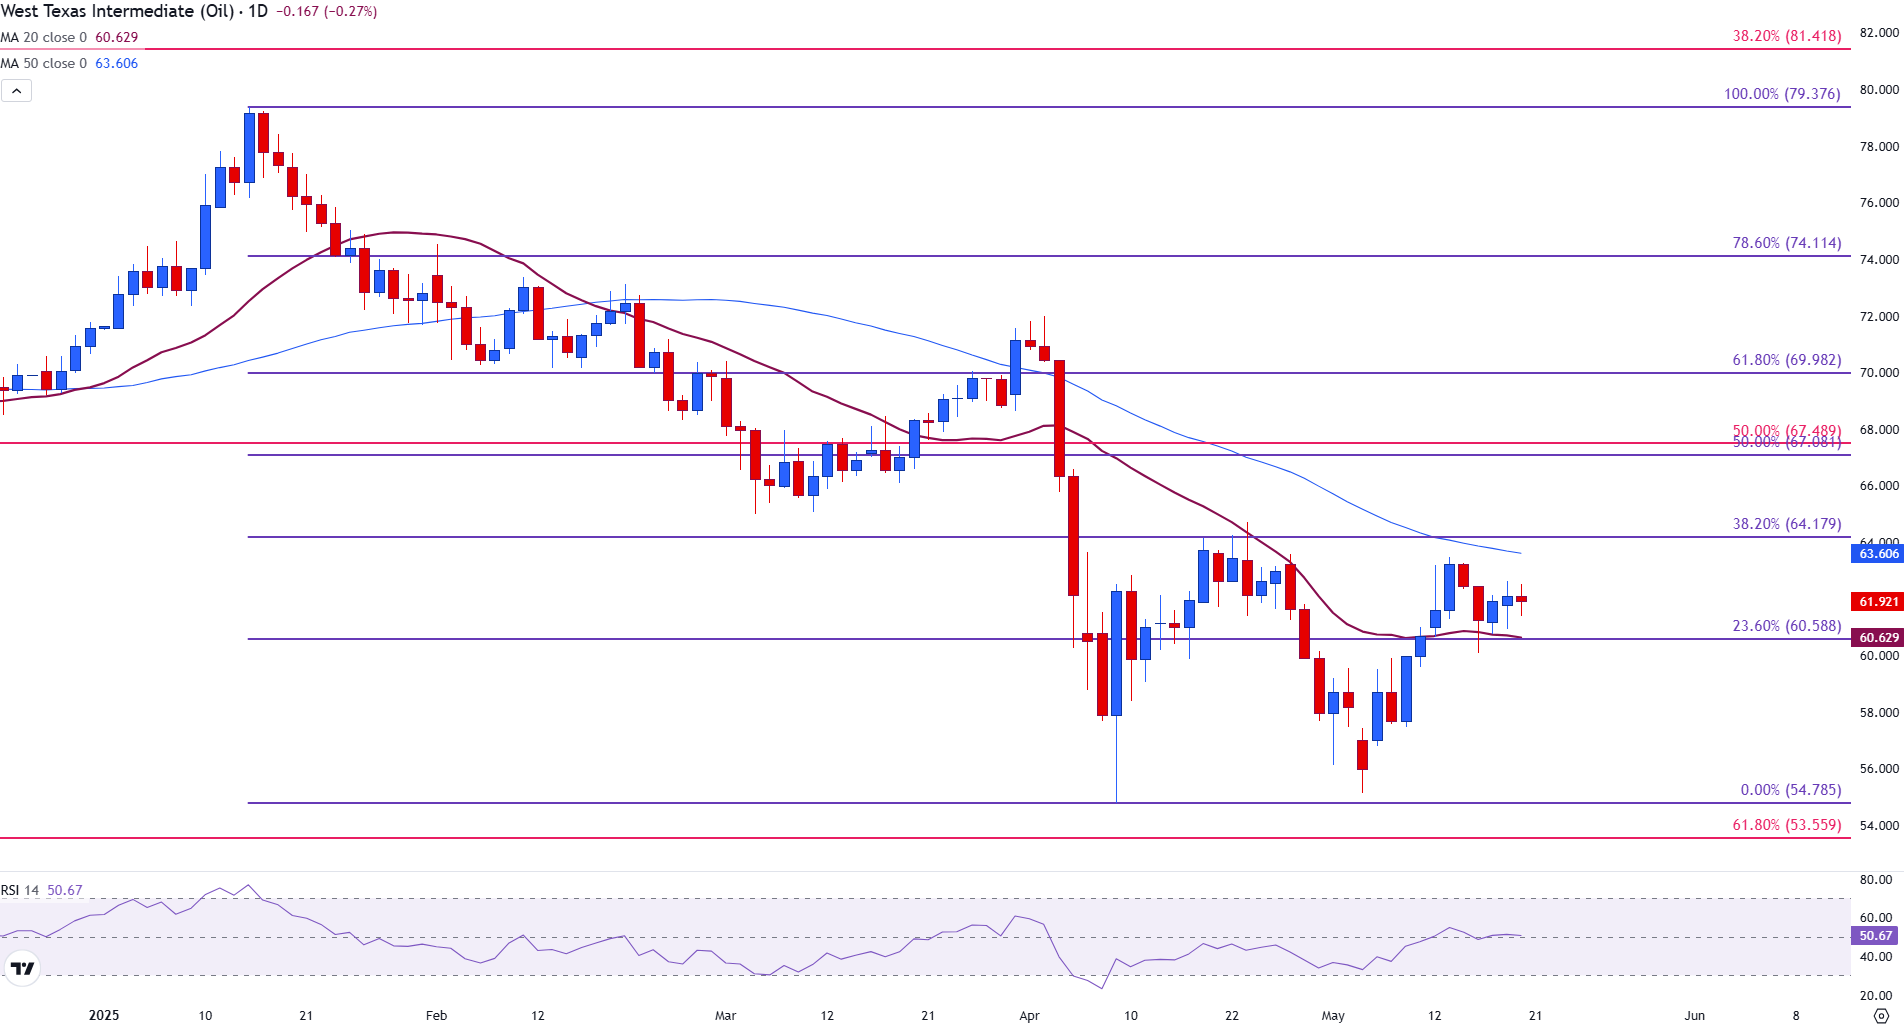
WTI Crude Oil remains in a consolidation phase, trading within a broader range defined by two key Fibonacci retracement levels stemming from the January–April decline. This zone has created a technical buffer, containing both upside and downside price action while signaling broader market indecision.
As short-term momentum continues to face resistance, which is being influenced by structural and macroeconomic headwinds, the 20 and 50-day Simple Moving Averages (SMA) are currently acting as dynamic zones of support and resistance, further compressing price movement and reinforcing the prevailing lack of directional conviction.
At the time of writing, WTI continues to hold above the psychological support level of $62.00. However, a decisive break below this threshold could open the path toward the 23.60% Fibonacci retracement of the YTD move at $60.588, which closely aligns with the 20-day SMA at $60.644. A breach of this zone may invite renewed selling pressure and a potential retest of the $60.00 handle.
From a momentum perspective, the Relative Strength Index (RSI) remains slightly above the neutral 50 threshold, indicating a cautious market tone as traders await further clarity from global fundamentals or geopolitical developments.
If economic conditions stabilize or oil demand forecasts strengthen, WTI could regain upward momentum, allowing bulls to aim for a retest of the 50-day SMA at $63.612 and toward the 38.20% Fibonacci retracement level at $64.179, a zone that marks a critical short-term resistance threshold.
WTI Oil FAQs
WTI Oil is a type of Crude Oil sold on international markets. The WTI stands for West Texas Intermediate, one of three major types including Brent and Dubai Crude. WTI is also referred to as “light” and “sweet” because of its relatively low gravity and sulfur content respectively. It is considered a high quality Oil that is easily refined. It is sourced in the United States and distributed via the Cushing hub, which is considered “The Pipeline Crossroads of the World”. It is a benchmark for the Oil market and WTI price is frequently quoted in the media.
Like all assets, supply and demand are the key drivers of WTI Oil price. As such, global growth can be a driver of increased demand and vice versa for weak global growth. Political instability, wars, and sanctions can disrupt supply and impact prices. The decisions of OPEC, a group of major Oil-producing countries, is another key driver of price. The value of the US Dollar influences the price of WTI Crude Oil, since Oil is predominantly traded in US Dollars, thus a weaker US Dollar can make Oil more affordable and vice versa.
The weekly Oil inventory reports published by the American Petroleum Institute (API) and the Energy Information Agency (EIA) impact the price of WTI Oil. Changes in inventories reflect fluctuating supply and demand. If the data shows a drop in inventories it can indicate increased demand, pushing up Oil price. Higher inventories can reflect increased supply, pushing down prices. API’s report is published every Tuesday and EIA’s the day after. Their results are usually similar, falling within 1% of each other 75% of the time. The EIA data is considered more reliable, since it is a government agency.
OPEC (Organization of the Petroleum Exporting Countries) is a group of 12 Oil-producing nations who collectively decide production quotas for member countries at twice-yearly meetings. Their decisions often impact WTI Oil prices. When OPEC decides to lower quotas, it can tighten supply, pushing up Oil prices. When OPEC increases production, it has the opposite effect. OPEC+ refers to an expanded group that includes ten extra non-OPEC members, the most notable of which is Russia.
Author

Tammy Da Costa, CFTe®
FXStreet
Tammy is an economist and market analyst with a deep passion for financial markets, particularly commodities and geopolitics.


