Woolworths Group Limited Elliott Wave technical forecast [Video]
![Woolworths Group Limited Elliott Wave technical forecast [Video]](https://editorial.fxstreet.com/images/Markets/Equities/Industries/Media/music-board_XtraLarge.jpg)
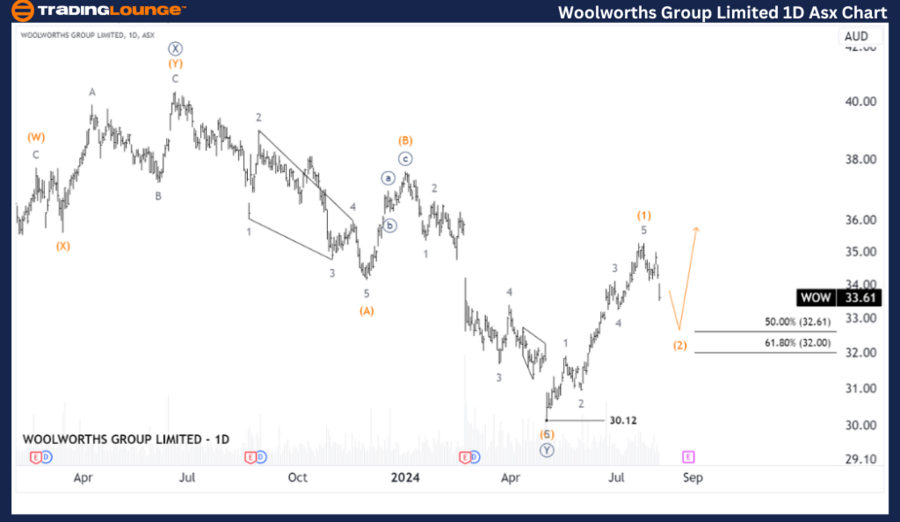
ASX: WOOLWORTHS GROUP LIMITED - WOW Elliott Elliott Wave Technical Analysis TradingLounge (1D Chart)
Greetings, Our Elliott Wave analysis today updates the Australian Stock Exchange (ASX) with WOOLWORTHS GROUP LIMITED - WOW. We see WOW.ASX potentially pushing lower in the short term.
ASX: WOW Elliott Wave technical analysis
Function: Major trend (Minute degree, navy).
Mode: Motive.
Structure: Impulse.
Position: Wave (iv)-orange of Wave ((iii))-navy.
Details: Wave (iii)-orange seems to have just ended, and wave (iv)-orange is unfolding to push lower, targeting 27.78. I will look for a Long Trade Setup after wave (2)-orange ends.
Invalidation point: 21.06.
ASX: WOW one-day chart
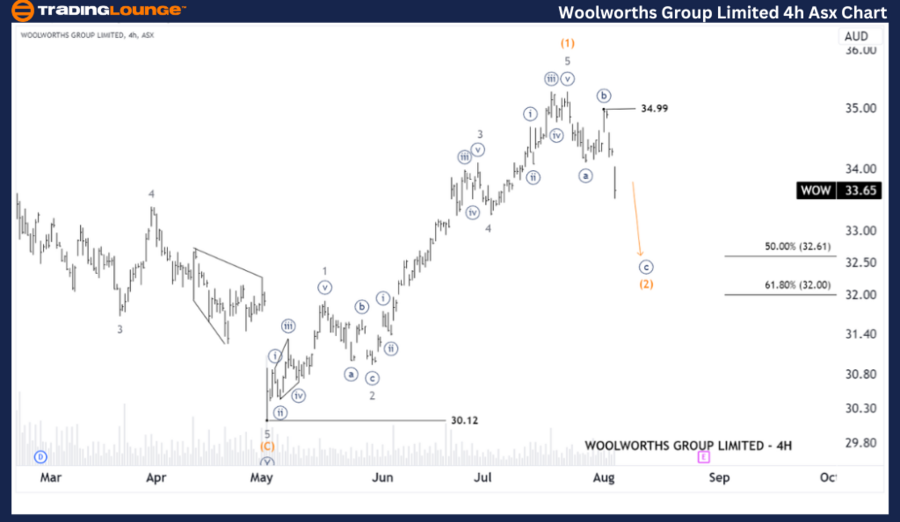
ASX: WOW four-hour chart analysis
Function: Major trend (Intermediate degree, orange).
Mode: Motive.
Structure: Impulse.
Position: Wave ©-navy of Wave (2)-orange.
Details: Wave (1)-orange has completed as a Five-waves, now it looks like wave (2)-orange is starting to unfold to push lower. It is developing as a Zigzag, wave ((b)) navy just completed at the high at 34.99, and wave ((c))-navy is unfolding to push lower, continuing towards the target around 32.61, I will look for a Long Trade Setup after wave (2)-orange ends.
Invalidation point: 30.12.
Conclusion: Our analysis, forecast of contextual trends, and short-term outlook for ASX: WOOLWORTHS GROUP LIMITED - WOW aim to provide readers with insights into the current market trends and how to capitalize on them effectively. We offer specific price points that act as validation or invalidation signals for our wave count, enhancing the confidence in our perspective. By combining these factors, we strive to offer readers the most objective and professional perspective on market trends.
Woolworths Group Limited Elliott Wave technical forecast [Video]
Author

Peter Mathers
TradingLounge
Peter Mathers started actively trading in 1982. He began his career at Hoei and Shoin, a Japanese futures trading company.


