Woodside Energy Group Ltd Elliott Wave forecast [Video]
![Woodside Energy Group Ltd Elliott Wave forecast [Video]](https://editorial.fxstreet.com/images/TechnicalAnalysis/ChartPatterns/Candlesticks/high-resolution-stock-exchange-evolution-panel-55741904_XtraLarge.jpg)
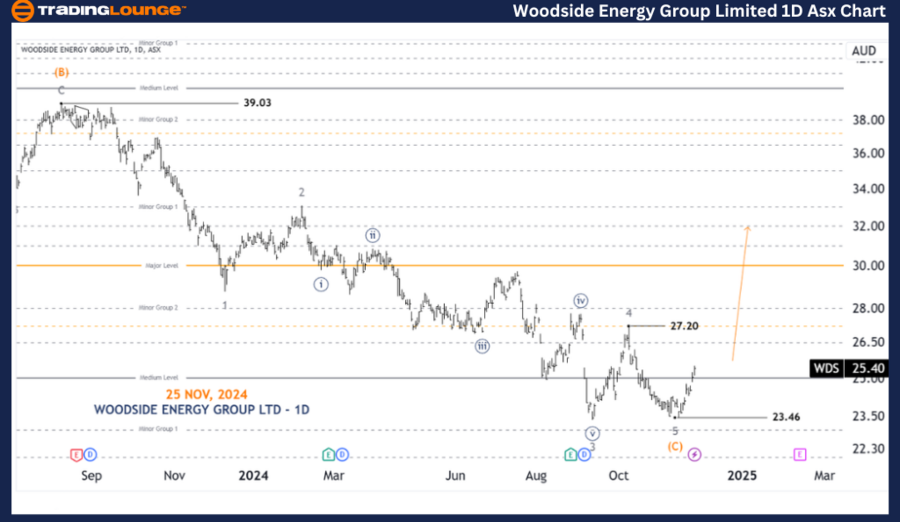
ASX: WDS Elliott Wave technical analysis
Greetings, Our Elliott Wave analysis today updates the Australian Stock Exchange (ASX) with WOODSIDE ENERGY GROUP LTD - WDS. We see that ASX:WDS may be showing some evidence of a ((iii))-navy wave unfolding to push higher. A push above 27.20 would further confirm this view.
ASX: WDS one-day chart analysis
Function: Major trend (Primary degree, navy).
Mode: Motive.
Structure: Impulse.
Position: Wave ((3))-navy.
Details: Wave ((2))-navy is showing some evidence that it has ended, and wave ((3))-navy may be unfolding. A push above 27.20 would clarify this view.
Invalidation point: 23.46.
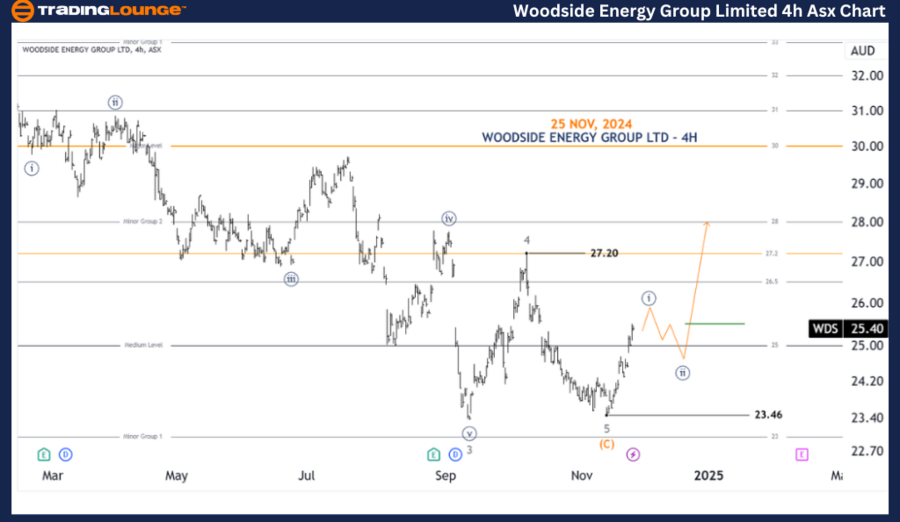
ASX: WDS four-hour chart analysis
Function: Major trend (Minuette degree, navy).
Mode: Motive.
Structure: Impulse.
Position: Wave ((i))-navy .
Details: Since the low at 23.46 there is probably a five-wave push up, it can be labeled wave ((i))-navy, basically it can push higher, then a pullback with wave ((ii))-navy is needed to push lower. And we can Go Long when price again pulls back up to push higher than wave B of wave ((ii))-navy then Medium Level 25.00 will become tested support, and we will have a quality Go Long position.
Invalidation point: 23.46.
Conclusion
Our analysis, forecast of contextual trends, and short-term outlook for ASX: WOODSIDE ENERGY GROUP LTD - WDS aim to provide readers with insights into the current market trends and how to capitalize on them effectively. We offer specific price points that act as validation or invalidation signals for our wave count, enhancing the confidence in our perspective. By combining these factors, we strive to offer readers the most objective and professional perspective on market trends.
Woodside Energy Group Ltd Elliott Wave forecast [Video]
Author

Peter Mathers
TradingLounge
Peter Mathers started actively trading in 1982. He began his career at Hoei and Shoin, a Japanese futures trading company.


