Wisetech Global Limited Elliott Wave technical forecast [Video]
![Wisetech Global Limited Elliott Wave technical forecast [Video]](https://editorial.fxstreet.com/images/TechnicalAnalysis/ChartPatterns/PointFigure/stock-market-data-18635784_XtraLarge.jpg)
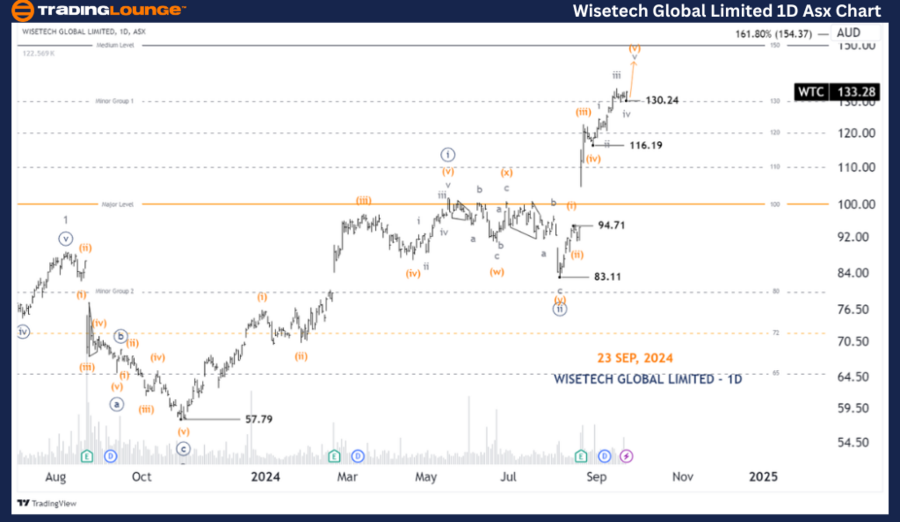
ASX: WISETECH GLOBAL LIMITED - WTC Elliott Elliott Wave Technical Analysis TradingLounge (1D Chart).
Greetings, Our Elliott Wave analysis today updates the Australian Stock Exchange (ASX) with WISETECH GLOBAL LIMITED - WTC. We see wave (v)-orange of wave ((iii))-navy still unfolding to push higher.
ASX: WTC one-day chart (semilog scale) analysis
Function: Major trend (Minute degree, navy).
Mode: Motive.
Structure: Impulse.
Position: Wave v-grey of Wave (v)-orange of Wave ((iii))-navy.
Details: Wave iv-grey may have just ended recently, and wave v-grey of wave (v)-orange is unfolding to push higher.
Invalidation point: 130.24.
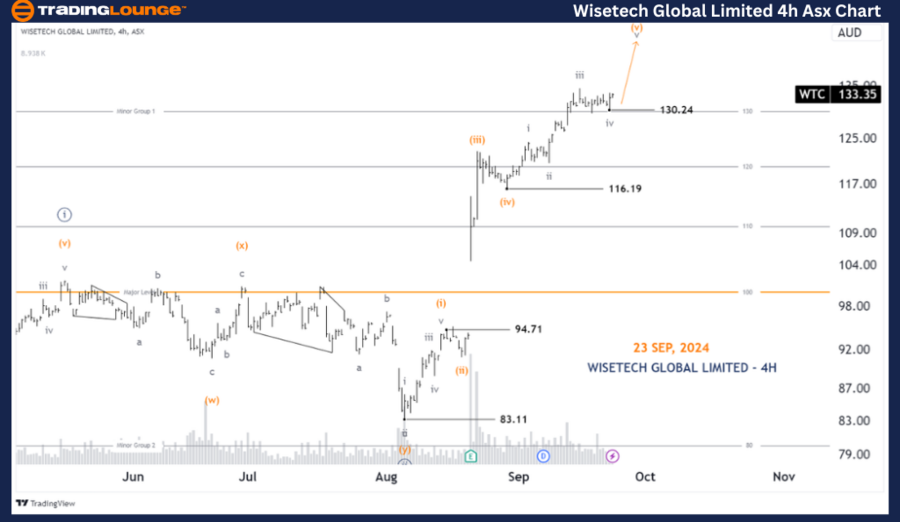
ASX: WTC four-hour chart analysis
Function: Major trend (Minuette degree, orange).
Mode: Motive.
Structure: Impulse.
Position: Wave v-grey of Wave (v)-orange.
Details: Wave iv-grey may have just ended recently, and wave v-grey of wave (v)-orange is unfolding to push higher, it may push up to the target at 138.00-140.00, breaking through this target will continue to advance to 150.00.
Invalidation point: 130.24.
Conclusion
Our analysis, forecast of contextual trends, and short-term outlook for ASX: WISETECH GLOBAL LIMITED - WTC aim to provide readers with insights into the current market trends and how to capitalize on them effectively. We offer specific price points that act as validation or invalidation signals for our wave count, enhancing the confidence in our perspective. By combining these factors, we strive to offer readers the most objective and professional perspective on market trends.
Wisetech Global Limited Elliott Wave technical forecast [Video]
Author

Peter Mathers
TradingLounge
Peter Mathers started actively trading in 1982. He began his career at Hoei and Shoin, a Japanese futures trading company.


