|

Will Costco Wholesale (COST) continue bullish rally?

Costco Wholesale Corporation., (COST) engages in the operation of membership warehouse in the United States & globally together with its subsidiaries. It offers branded & private-label products in the range of merchandise categories. It also operates e-commerce websites in the US, Canada, UK & many other countries. It is based in Issaquah, Washington, comes under Consumer Defensive sector & trades as “COST” ticker at Nasdaq.

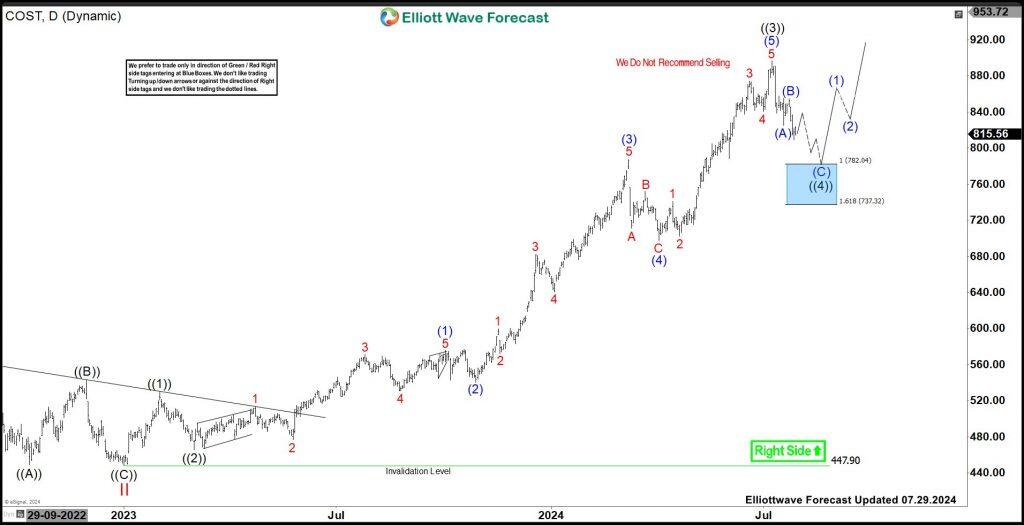
As shown in the last article, COST ended ((4)) at $793 low & favors upside in ((5)) to finish III sequence in daily. It already broke to new high above ((3)) & expect short term extension towards $921.44 or higher levels to finish III.

COST – Elliott Wave daily view from 7.29.2024
Chart
 

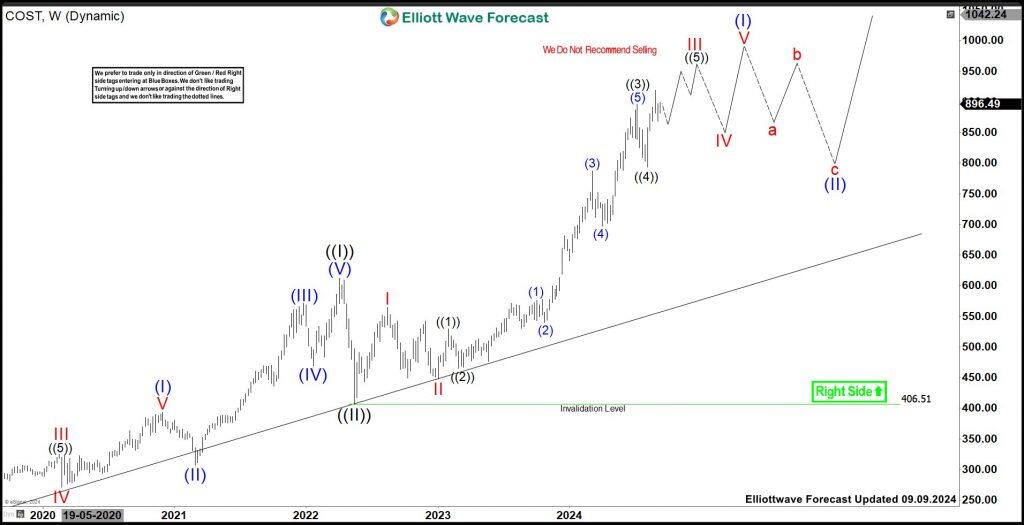
In Weekly sequence, it placed ((I)) at $612.27 high in April-2022 as impulse sequence & ((II)) at $406.51 low in May-2022 as sharp pullback. It placed I of (I) of ((III)) at $564.75 high & pullback in II at $447.90 low in January-2023. Above there, it favors upside in III of (I) & expect short term upside, while dips remain above 5-August-2024 low in ((5)).

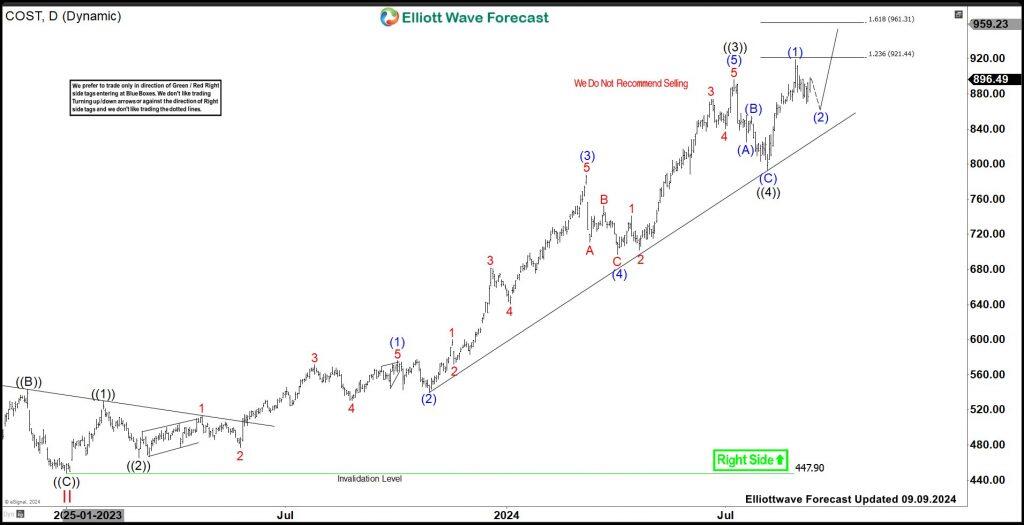
COST – Elliott Wave latest daily view
Chart

Above II low, it placed ((1)) at $530.05 high, ((2)) at $465.33 low & ((3)) at $896.67 high as extended wave. Within III, it placed (1) at $576.19 high, (2) at $540.23 low, (3) at $787.08 high, (4) at $697.27 low & (5) at $896.67 high as ((3)). It ended ((4)) at $793 low in August-2024 low, which missed the extreme areas. Currently, it favors upside in ((5)) to finish III towards $921.44 – $961.31 area. Short term, it favors pullback in (2) before resume upside in (3) & expect two more highs to finish III. Alternatively, if it breaks below $793 low, it should correct in IV, while placed III at last high, which will provide the next buying opportunity.

COST – Elliott Wave latest weekly view
COST

Author

Elliott Wave Forecast Team

Elliott Wave Forecast Team

ElliottWave-Forecast.com

More from Elliott Wave Forecast Team
Share:

Editor's Picks

AUD/USD flirts with 0.7000, lowest since early August amid bullish USD

AUD/USD hits a fresh low since early August during the Asian session on Friday and looks vulnerable near 0.7000 after breaking below the 200-day SMA overnight. Against the backdrop of the hawkish Fed, a two-day rally in oil prices revives inflation fears and continues to push US bond yields to multi-year highs. Adding to this, geopolitical risks lift the US Dollar to a two-month high, overshadowing RBA rate hike bets and weighing on the pair.

USD/JPY pulls back from three-week high after failing near 159.00

USD/JPY edges lower during the Asian session on Friday, stalling its recent strong move to a three-week high of 159.00 as Japanese Yen bears turn cautious amid intervention fears. Meanwhile, the US Dollar retains a strong bullish undertone as the Fed's hawkish outlook and oil-driven inflation fears continue to push US bond yields to multi-year peaks. Furthermore, the BoJ's dovish rate hike last week might cap JPY and support spot prices.

Gold treads water below $4,300

Gold grabs some buying attention and advances marginally at the end of the week, partially retracing the weekly decline, although it is still navigating below the key $4,300 mark per troy ounce. The fresh selling bias on the Greenback and the modest decline in US Treasury yields appear to support the humble advance in the precious metal.

Week ahead: Rate hike bets face a crucial data week
Despite the solid drop from the mid-September high, oil prices remained in the driver’s seat for another week, setting the tone in financial markets. Six months have passed since the late-February start of the US-Iran conflict, and there is still no breakthrough in the stalled talks, despite pressure from regional leaders and the rest of the world.
CFTC Report: Defensive currency positioning takes hold
The week in one sentence: Sterling and Euro shorts deepened in the week to September 22, while Yen longs were cut sharply. Oil positioning improved despite a steep price decline, and Gold exposure remained crowded. The main signal was a more defensive currency positioning backdrop.
Fed vs BoJ: Both hiked. The market only believes one of them – and the chart shows which

The Fed and the BoJ have just done something remarkably similar. Both central banks raised interest rates by 25 bps last week, both are confronting inflation risks, and both signal that future decisions will depend on incoming economic data.















