|

Where is the S&P 500 heading next?

At this time of writing, the US index futures are down around 2% and the S&P500 is trading around the previous lows.

Those lows were captured by the 38.2% Fibonacci retracement level as shown in the chart below.

This uses the range from the March 2020 low to the recent all-time high giving us a price target of 3812. This is circled in red.

Chart

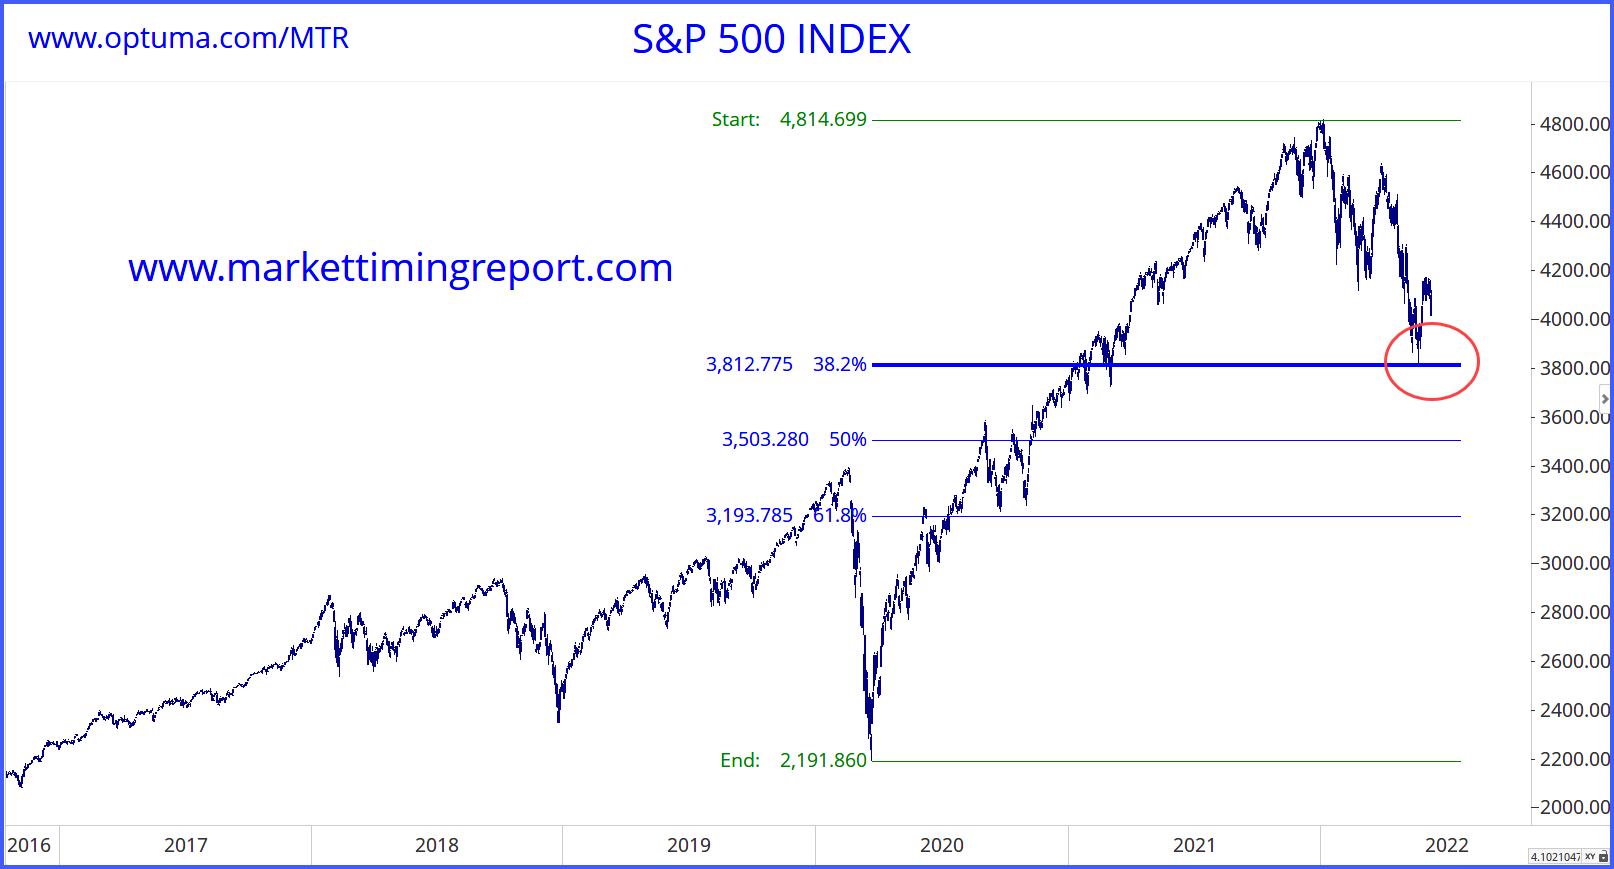
This is clearly a line in the sand and an important support level.

If this level fails then the next clear target level would be the 50% retracement level at 3503.

Thereafter we see a price target at the 61.8% level around 3193. This could be a significant target and in order to understand that, we need to zoom out further.

Here is the history of the S&P500 Index all the way back to the “Global Financial Crisis” in 2008 with the final low coming in spring 2009.

Chart

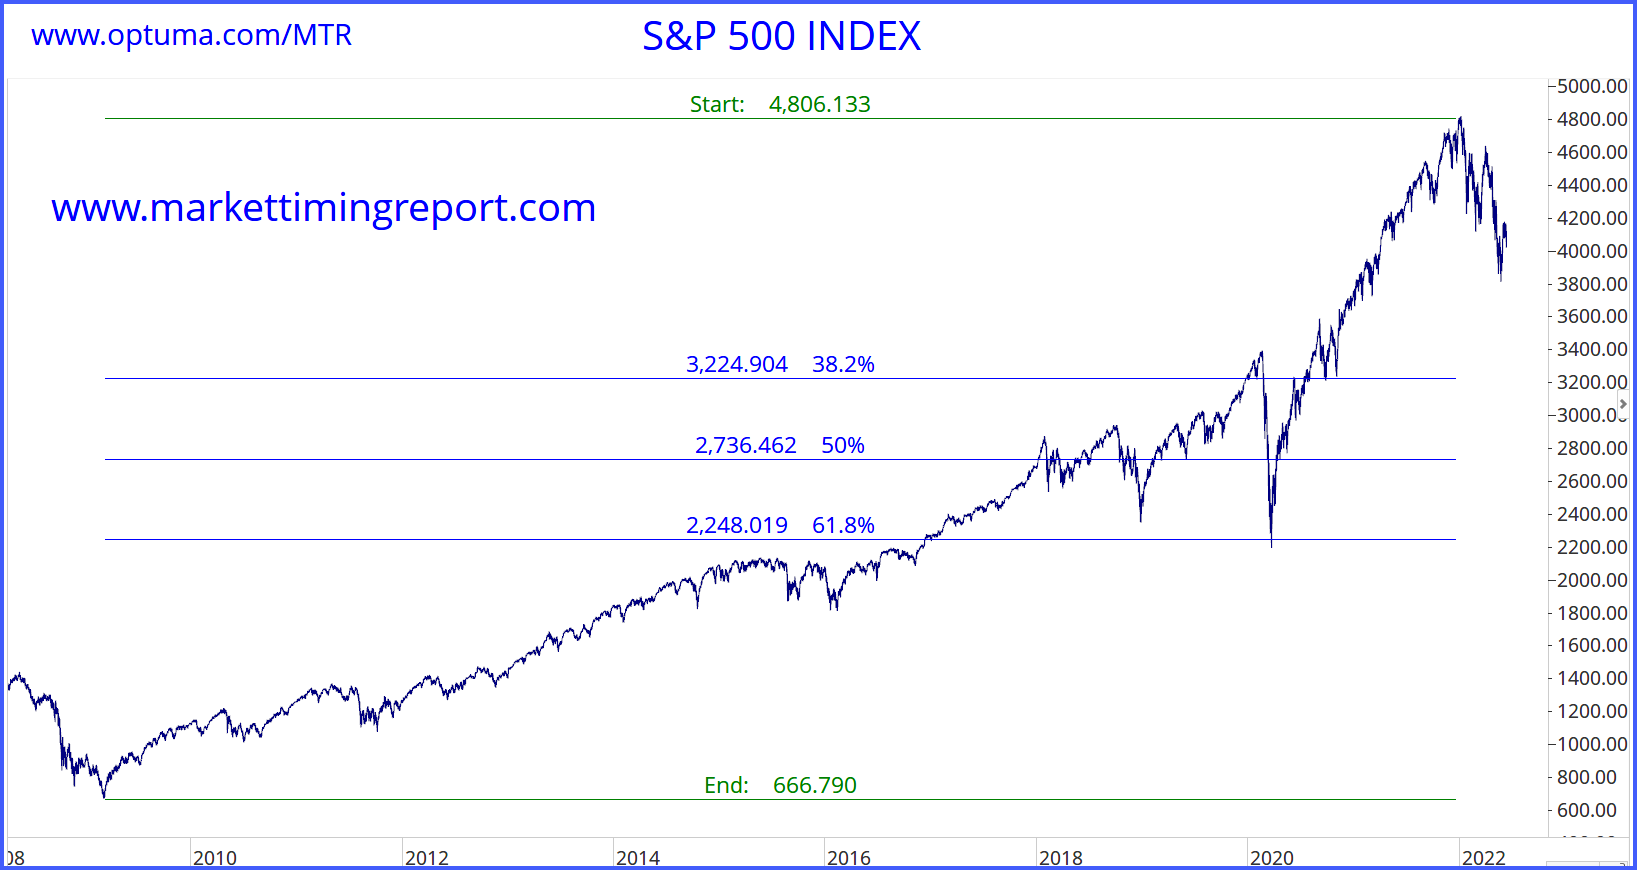
The Fibonacci retracements are marked on this and the major 38.2% level sits at 3224.

This will be a significant support level.

Now let us overlay both sets of retracements and we see the following.

Chart

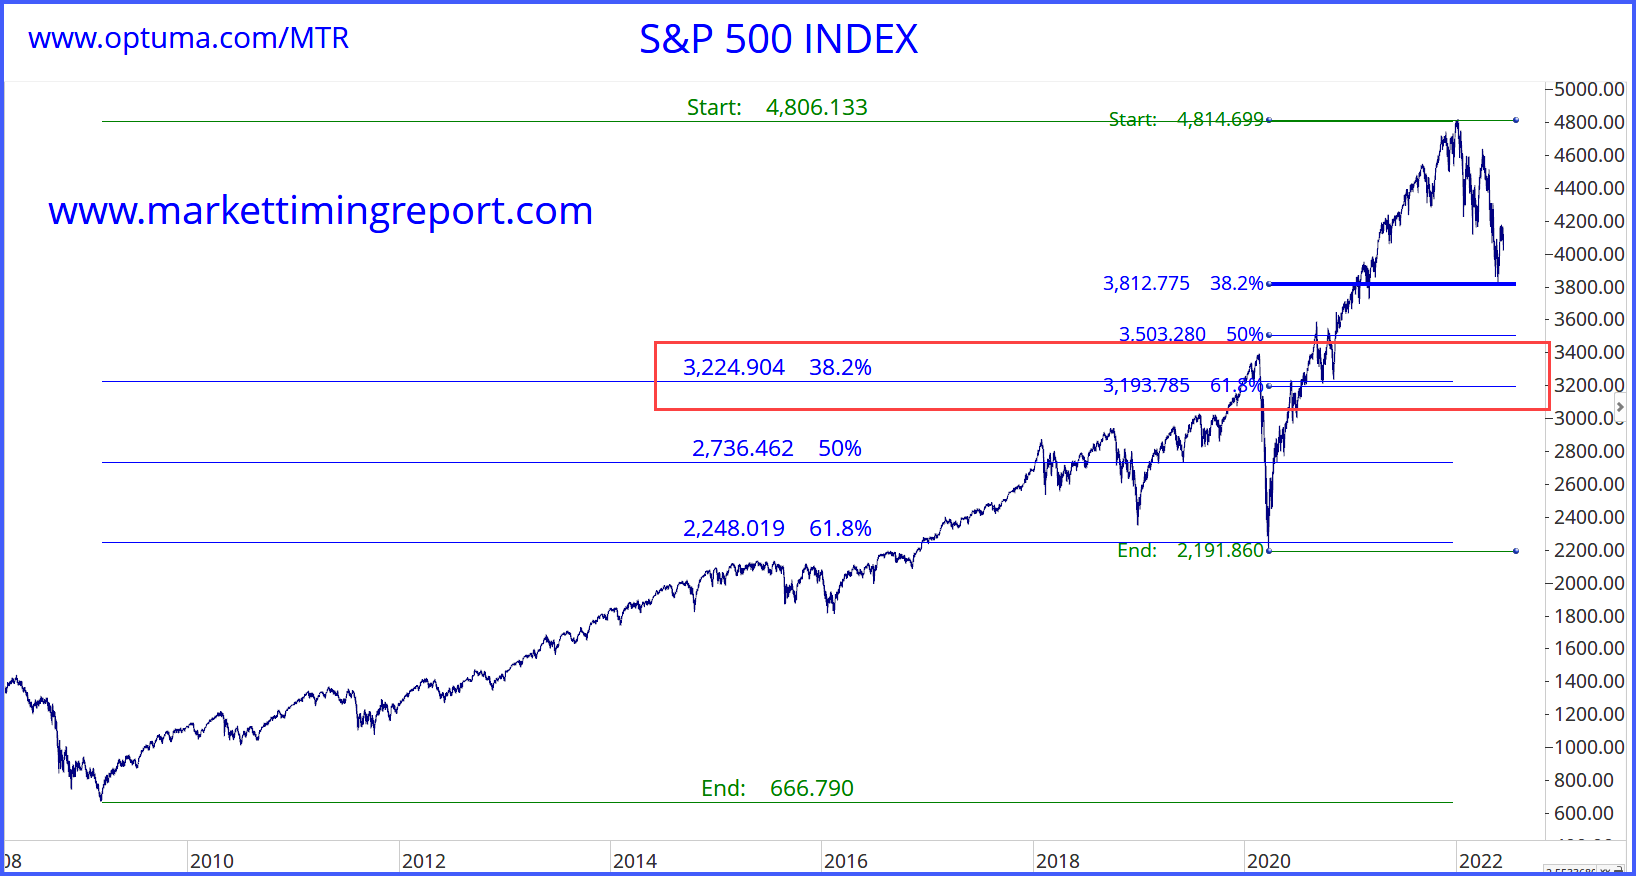
The 61.8% retracement of the smaller range is at 3193 and the 39.2% retracement of the larger range is at 3224.

These two numbers are within 1% of each other. See the red boxed area.

In conclusion, this analysis suggests that, should the down move continue then the next target level will be around 3503 and after that we see a significant support level between the prices of 3193 to 3224.

If either of these prices levels line up with our timing cycles, then we can expect a potentially important reversal. The last major time cycle was on the 8th June which heralded this latest sharp decline. 

Author

Andrew Pancholi

Andrew Pancholi

Market Timing Report

Andrew Pancholi is a world-renowned trading expert specializing in market timing.

More from Andrew Pancholi
Share:

Editor's Picks

EUR/USD bounces off lows, back to 1.1860

EUR/USD now manages to regain some balance, retesting the 1.1860-1.1870 band after bottoming out near 1.1830 following the US NFP data on Wednesday. The pair, in the meantime, remains on the defensive amid fresh upside traction surrounding the US Dollar.

GBP/USD rebounds to 1.3660, USD loses momentum

GBP/USD trades with decent gains in the 1.3660 region, regaining composure following the post-NFP knee-jerk toward the 1.3600 zone on Wednesday. Cable, in the meantime, should now shift its attention to key UK data due on Thursday, including preliminary GDP gauges.

Gold stays bid, still below $5,100

Gold keeps the bid tone well in place on Wednesday, retargeting the $5,100 zone per troy ounce on the back of humble gains in the US Dollar and firm US Treasury yields across the curve. Moving forward, the yellow metal’s next test will come from the release of US CPI figures on Friday.

Ripple Price Forecast: XRP sell-side pressure intensifies despite surge in addresses transacting on-chain 

Ripple (XRP) is edging lower around $1.36 at the time of writing on Wednesday, weighed down by low retail interest and macroeconomic uncertainty, which is accelerating risk-off sentiment.

US jobs data surprises to the upside, boosts stocks but pushes back Fed rate cut expectations

This was an unusual payrolls report for two reasons. Firstly, because it was released on  Wednesday, and secondly, because it included the 2025 revisions alongside the January NFP figure.

XRP sell-off deepens amid weak retail interest, risk-off sentiment

Ripple (XRP) is edging lower around $1.36 at the time of writing on Wednesday, weighed down by low retail interest and macroeconomic uncertainty, which is accelerating risk-off sentiment.