What these subtle signs say about the S&P 500 [Video]
![What these subtle signs say about the S&P 500 [Video]](https://editorial.fxstreet.com/images/Markets/Equities/SP500/wall_street_nyse2-637299021353183737.jpg)
Watch the free-preview video below extracted from the WLGC session before the market open on 20 May 2024 to find out the following:
-
How to interpret the S&P 500’s behavior when testing previous all-time highs.
-
How to anticipate market movements based on supply-demand dynamics.
-
How a trading range could unfold for the S&P 500.
-
And a lot more…
Market environment
The bullish vs. bearish setup is 619 to 105 from the screenshot of my stock screener below.
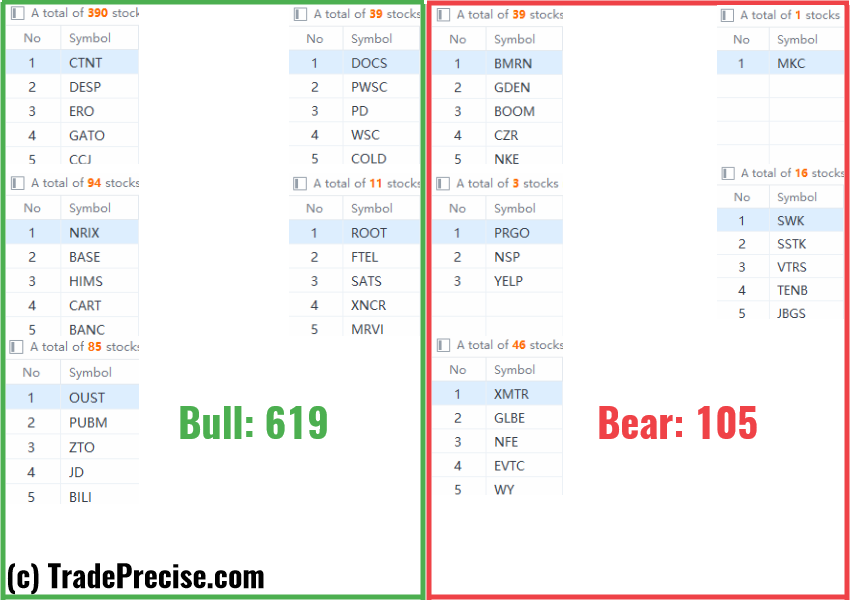
The market environment is improving compared to last week while both the long-term and short-term market breadth are in the healthy zone.
Most importantly, the trade entry setups as discussed in the live session for the past few weeks are still going well.
The Bitcoin-related stocks just had a strong rally on Tuesday thanks to the continuation of the strong uptrend in the Bitcoin, highlighted in the market update email on Monday.
Market comment
8 “low-hanging fruits” (TNDM, LNTH) trade entries setups + 15 actionable setups (COIN) were discussed during the live session before the market open (BMO).
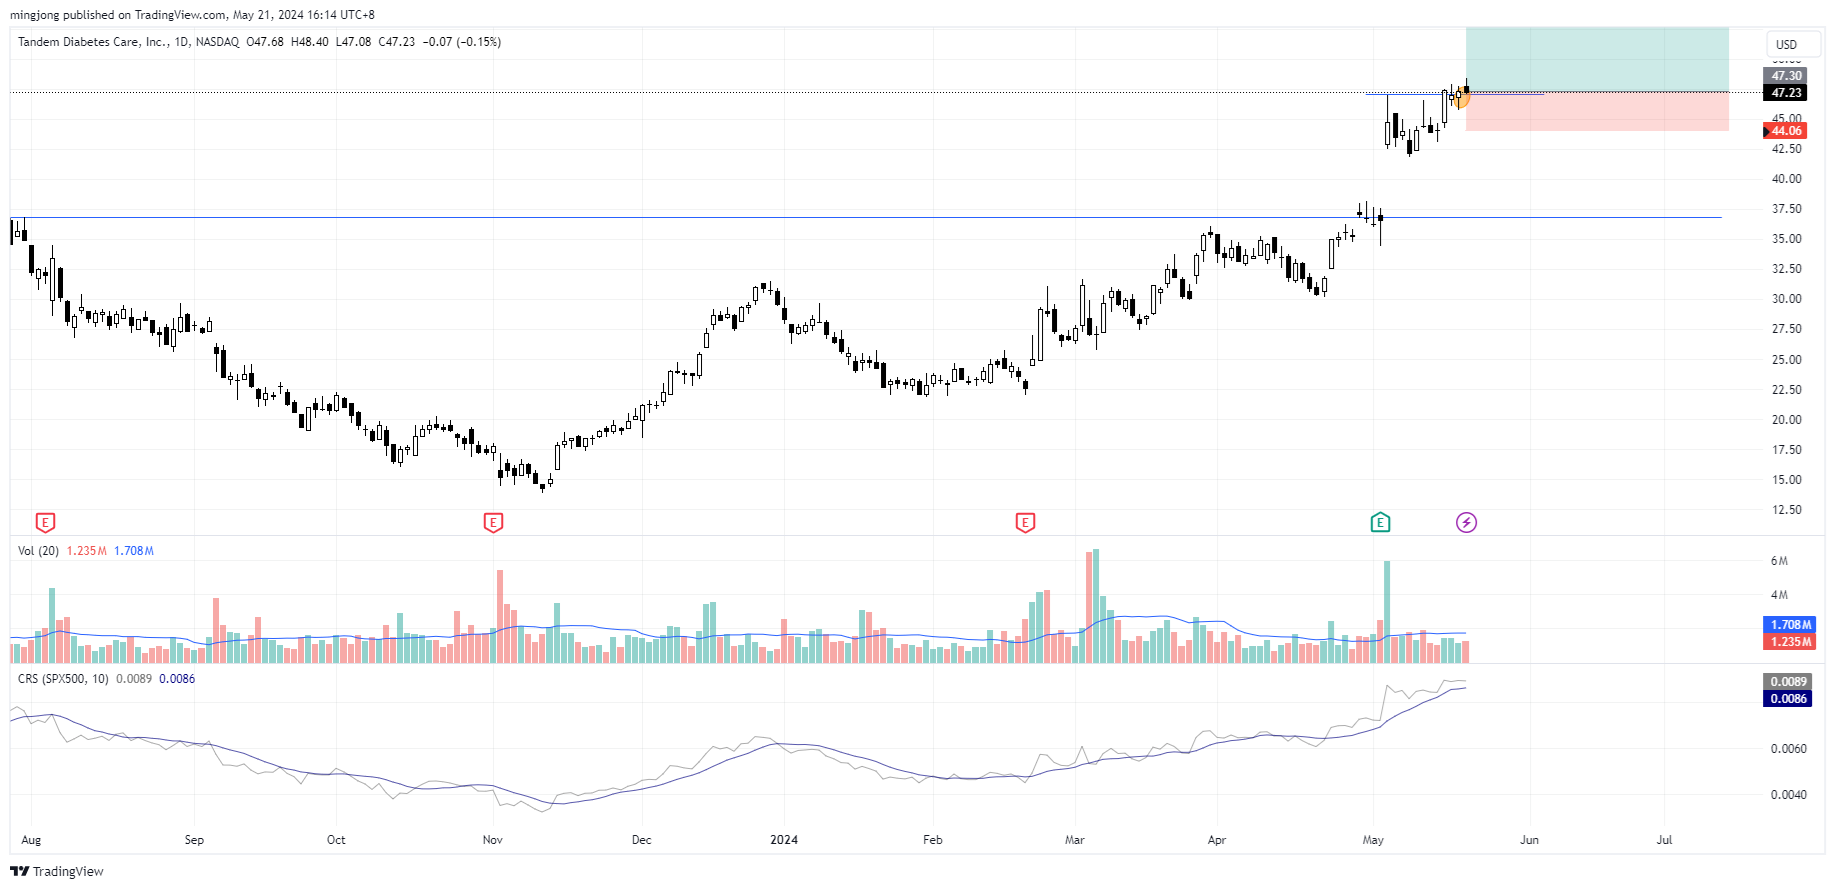
TNDM
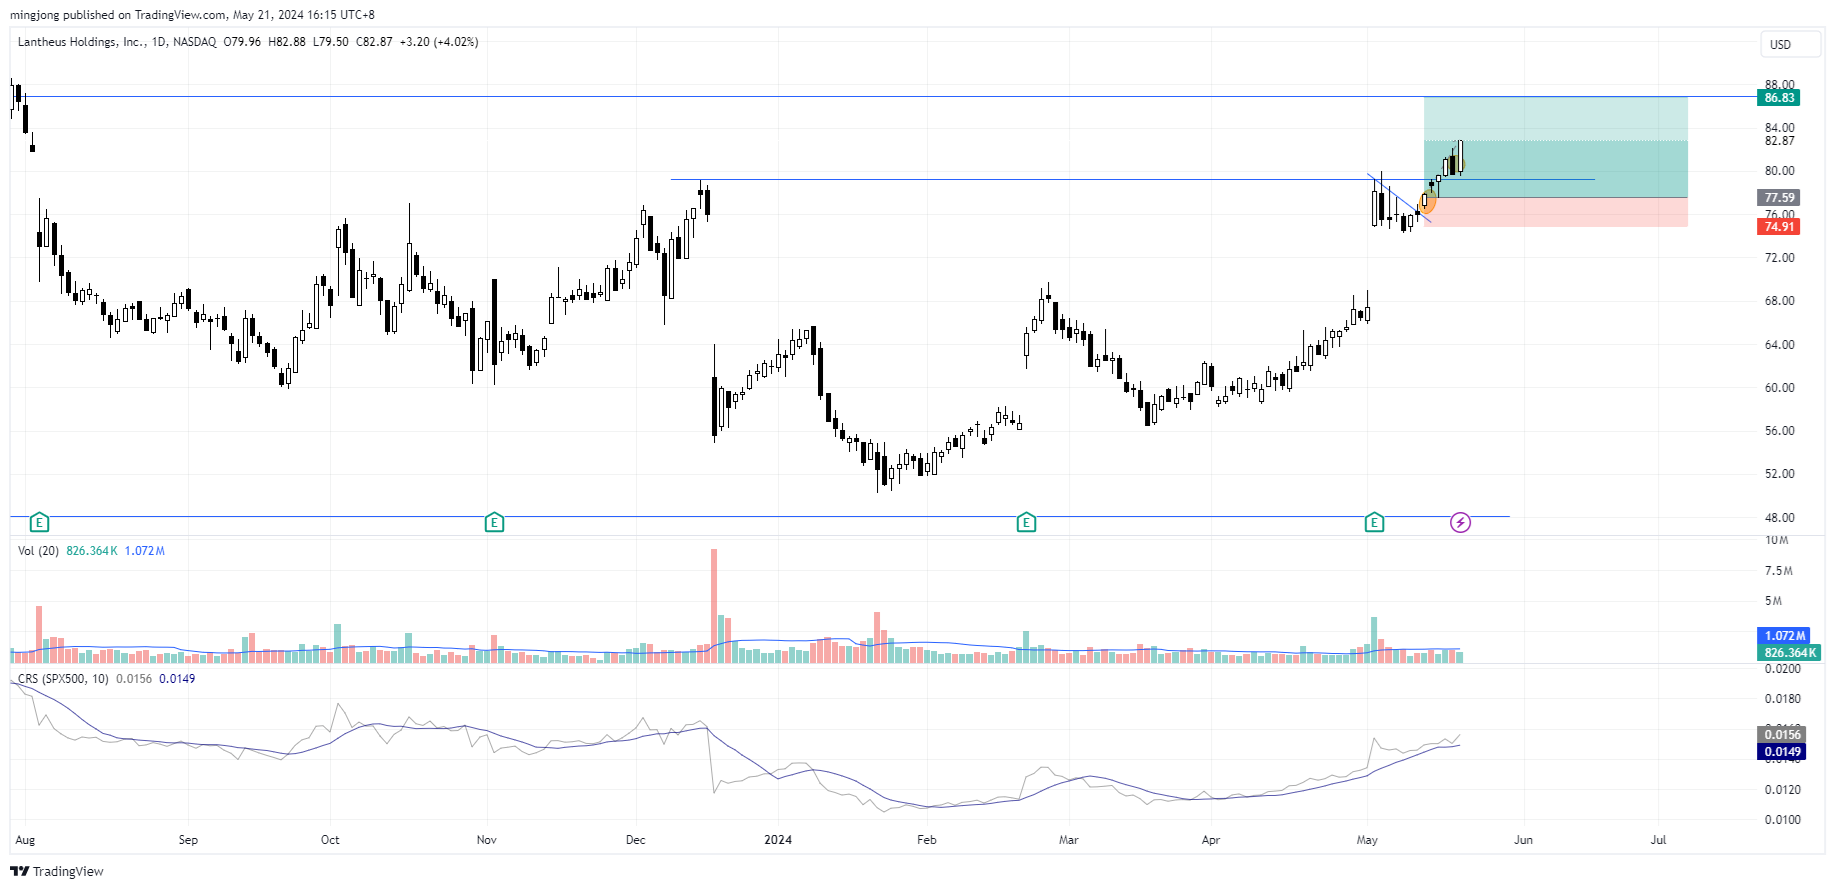
LNTH
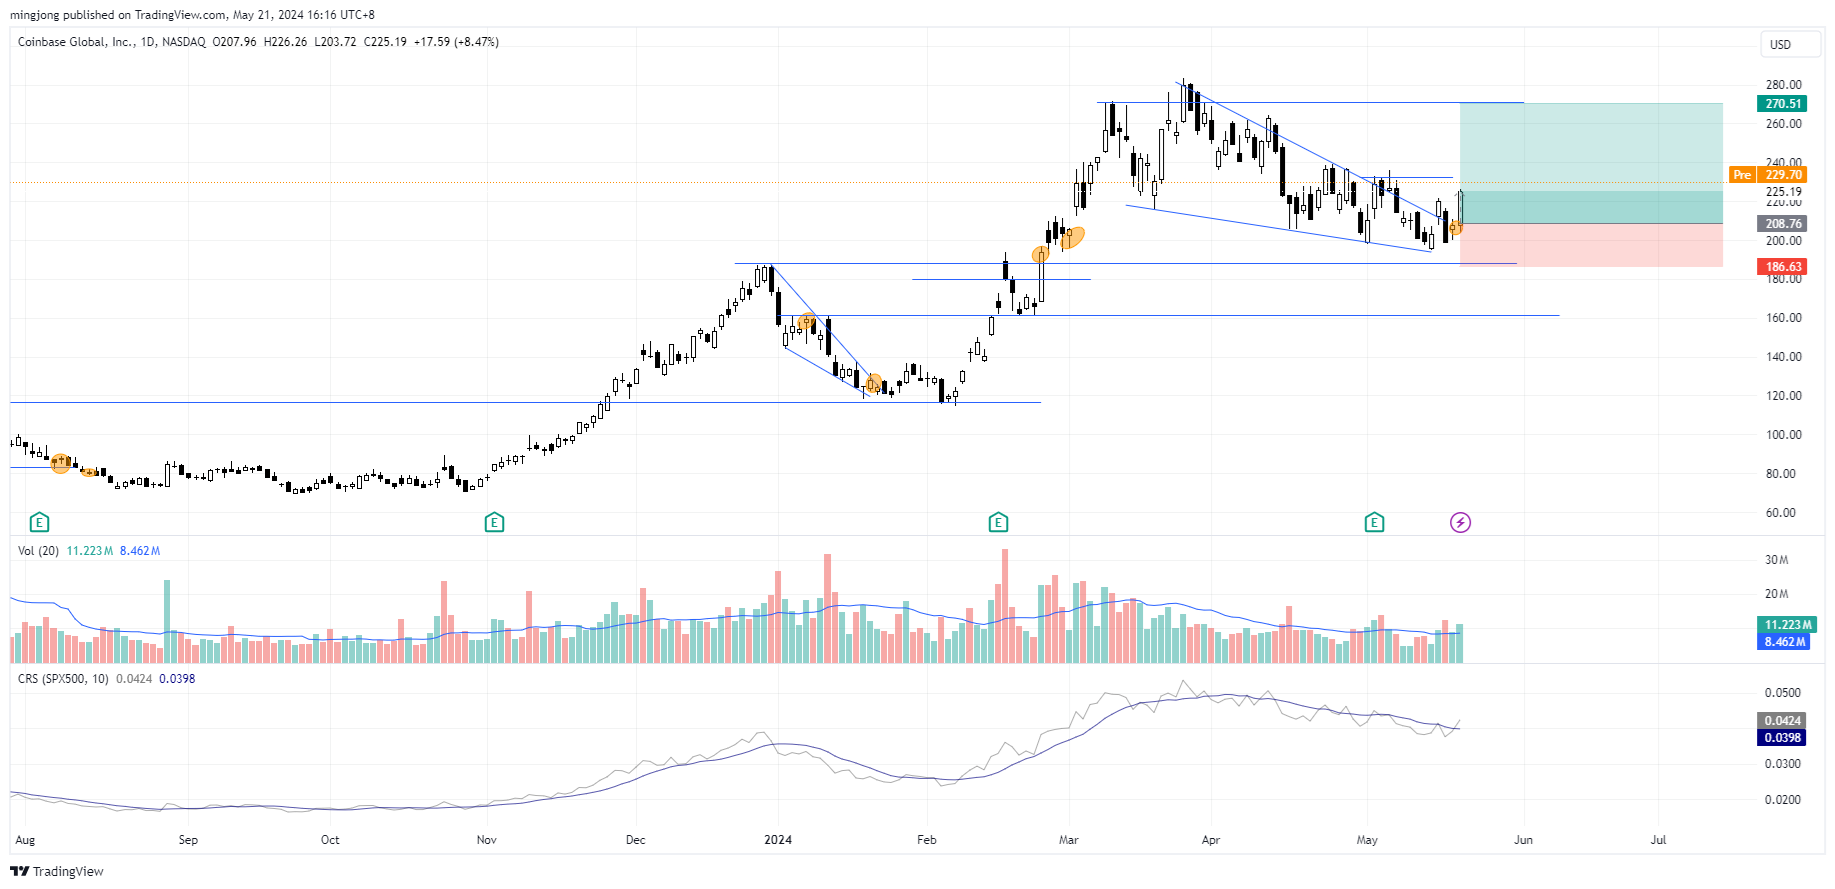
COIN
Author

Ming Jong Tey
Independent Analyst
Ming Jong Tey has been trading since 2008. He started his learning journey from technical analysis (indicators, Fibonacci, etc...) to value investing. Throughout his journey, he develops an interest in price action with chart pattern trading.