What does the MACD say about the NAS100 and the SPX?

This year has been no joke for the US stock market.
Of the 24 weekly candles that make up this year's chart on the S&P 500 (SPX), only 7 have finished bullish. The Dow jones Industrial Average (US30) and the Nasdaq Composite (NAS100), the US’s 2 other major indices, have followed similarly in 2022. We have not seen drastic falls like this in quite some time. Even with the sharp decline experienced during the beginning stages of the pandemic in 2020, it did not last as long as its current state of decline.
The US Federal Reserve raised its benchmark interest rates by 75-basis points last week, their largest single hike since 1994. That action by the Fed helped push stocks down further. But not before one session of growth, on the day of the announcement, which was attributed to investor confidence that the Fed is taking inflation more seriously and is willing to implement drastic measures to settle the economy.
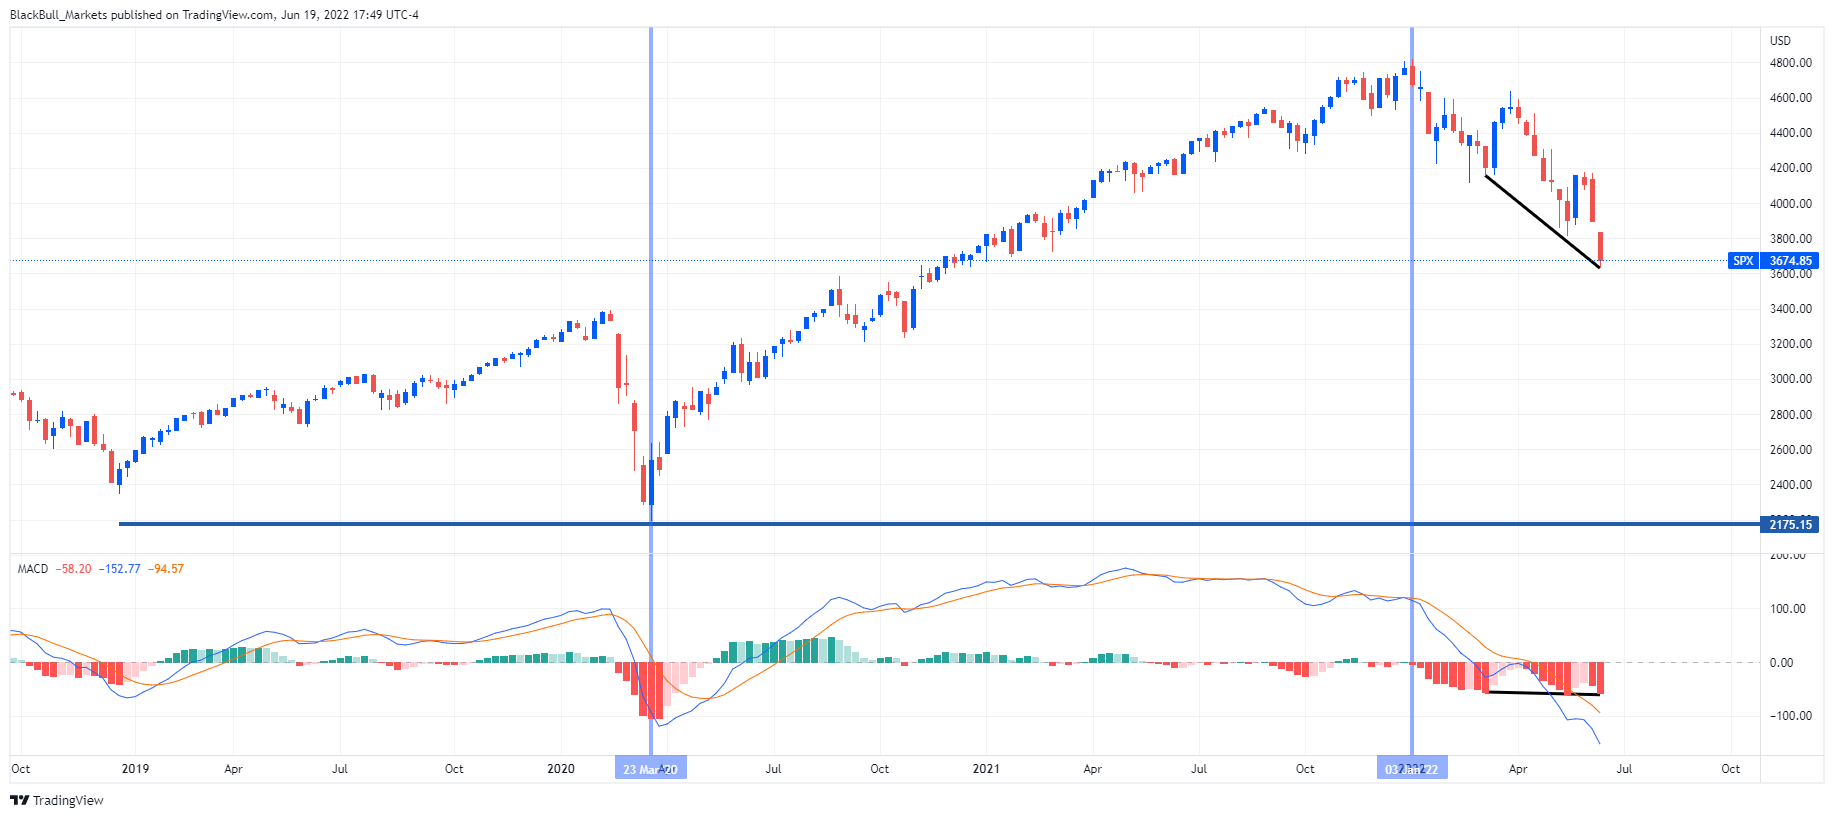
Looking at Nasdaq and the SPX weekly charts these are a couple of things that stick out. One thing is the drop both indices made during the spring of 2020 when the pandemic hit the market. While the S&P 500 made a lower low, the NAS100 did not. Here the Nasdaq was tipping its hat to the strength it would show over the next year as its percentage gains outperformed the SPX.
But as the saying goes, the bigger they are the harder they fall, and we now have the NAS100 down 30% year-to-date, while the SPX is down 23%. But does the MACD indicator suggest that these indices might pull up even with one another in the future?
MACD applied to NAS100 and SPX
The Moving Average Convergence Divergence (MACD) is one of the most popular indicators used by stock traders.
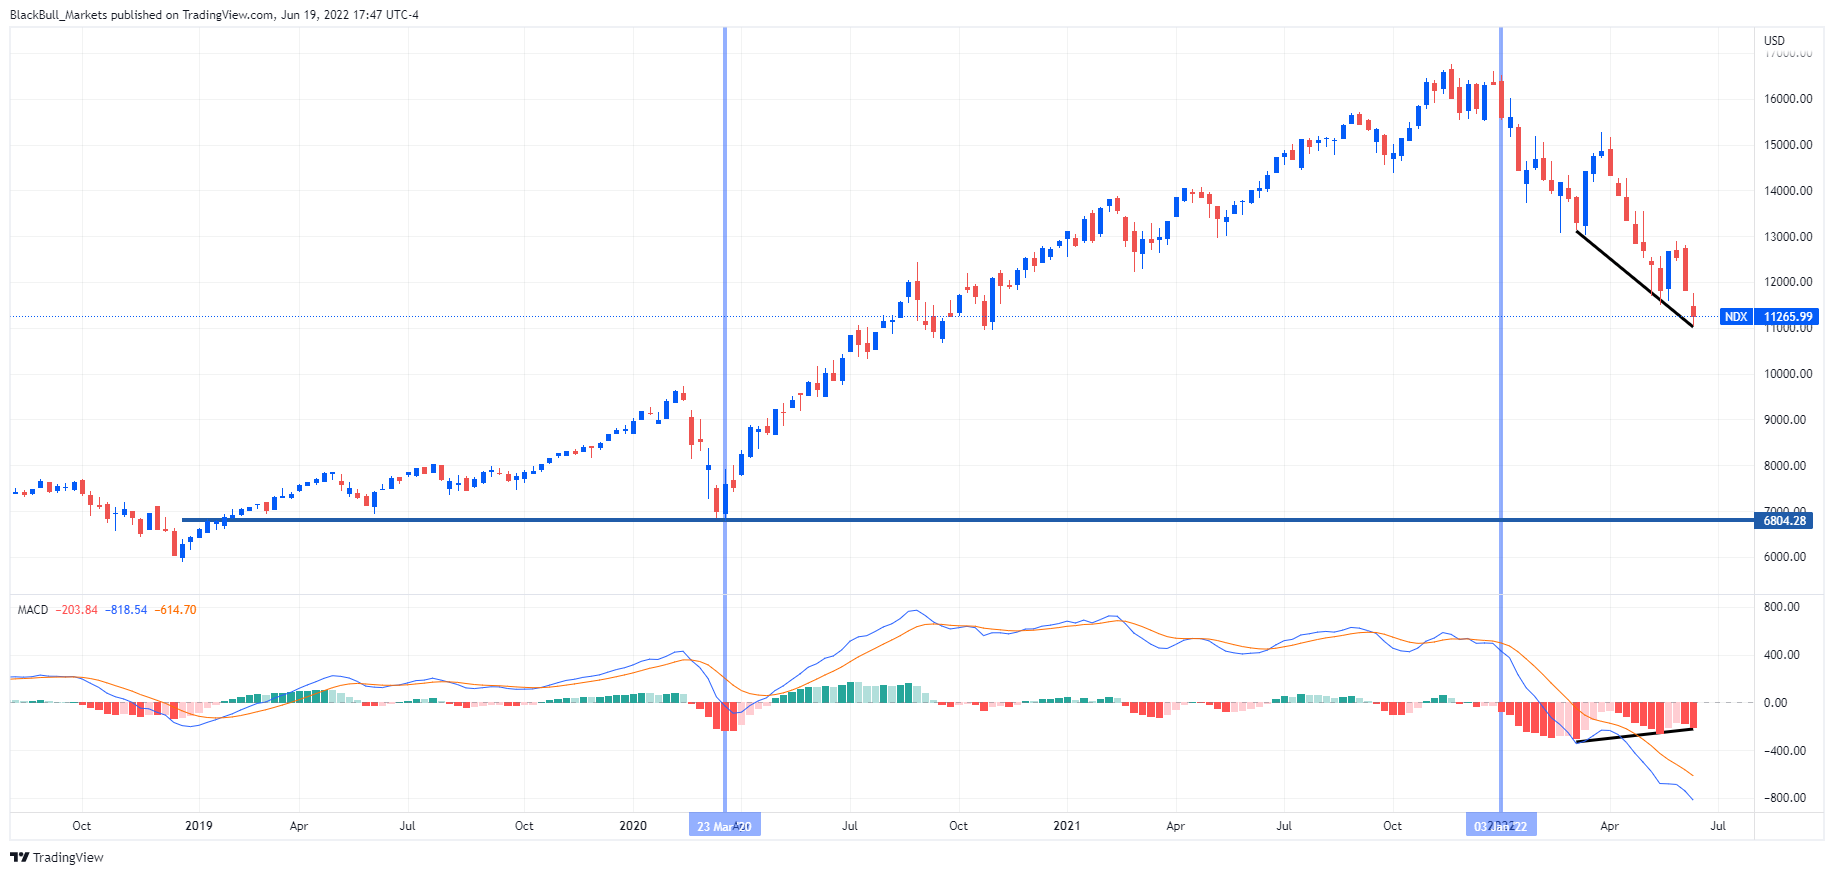
The histogram portion of the MACD is an indicator for momentum by visualising the divergence of a short-term and a long-term moving average. In the MACD applied to the charts below, we can see the red histogram bars possibly shrinking in comparison to the last push down in the NAS100. As prices are still falling heavily, this may indicate that momentum is slowing. For the SPX, the red histogram bars are effectively flat, if not growing slightly. The question that springs to mind here is whether the SPX downward momentum is about to outpace the NAS100?
Short or long the NAS100 and the SPX in less than 5 minutes
Author

Mark O’Donnell
Blackbull Markets Limited
Mark O’Donnell is a Research Analyst with BlackBull Markets in Auckland, New Zealand.


