Westpac Banking Corporation Elliott Wave analysis [Video]
![Westpac Banking Corporation Elliott Wave analysis [Video]](https://editorial.fxstreet.com/images/i/bullish-chart_XtraLarge.png)
ASX: WBC Elliott Wave technical analysis
Greetings, Our Elliott Wave analysis today updates the Australian Stock Exchange (ASX) with WESTPAC BANKING CORPORATION - WBC. We see that ASX:WBC may have completed a Triangle pattern and is poised to move higher on Thursday. This analysis also provides readers with key price levels to help determine when this view is valid, when it is rejected and when a Bullish confirmation trend is likely to begin.
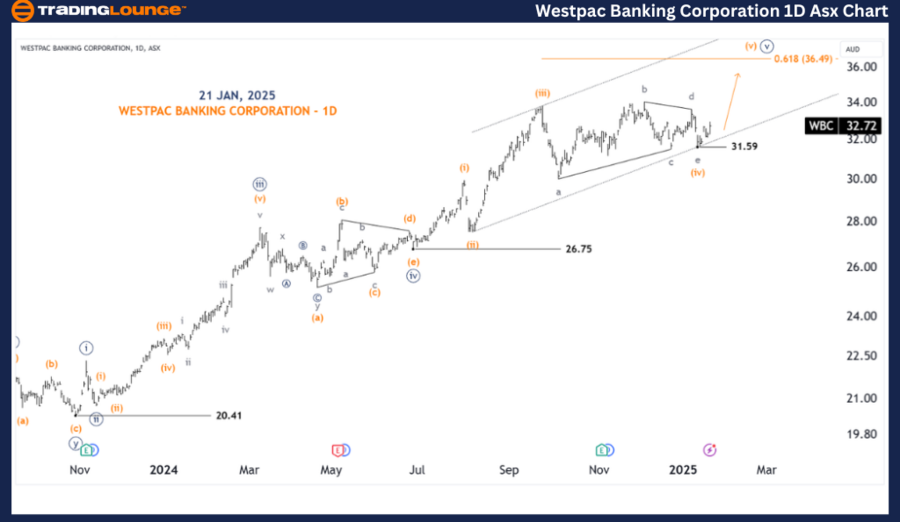
ASX: WBC one-day chart (semilog scale) analysis
Function: Major trend (Minute degree, navy).
Mode: Motive.
Structure: Impulse.
Position: Wave (v)-orange of Wave ((v))-navy.
Details: We see a Triangle with the fourth wave just completed at the low of 31.59. And it is followed by the (v)-orange wave that is starting to unfold to move higher, targeting around 36.49 or as high as the upper edge of the Channel, while the price must remain above 31.59 to maintain this view.
Invalidation point: 31.59.
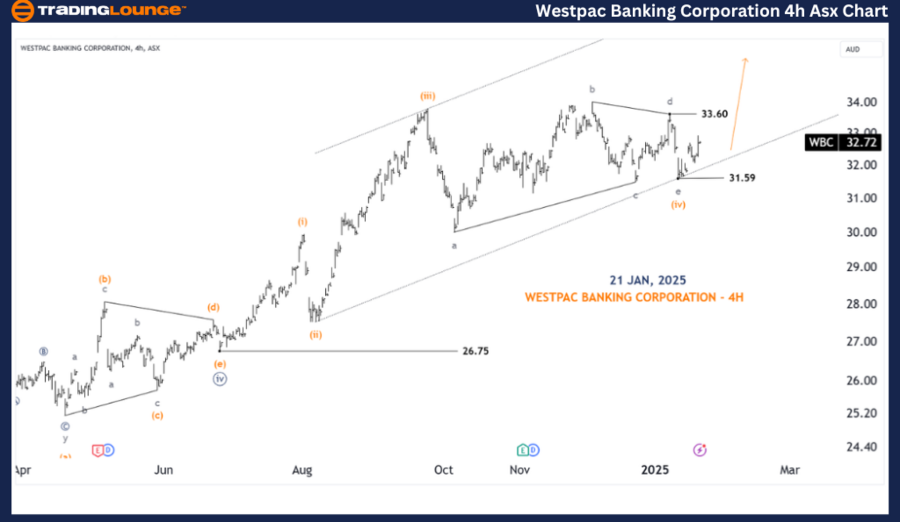
ASX: WBC four-hour chart analysis
Function: Major Trend (Minor degree, grey).
Mode: Motive.
Structure: Impulse.
Position: Wave (v)-orange.
Details: Nothing has changed, besides the push above 33.60 (the end point of the d-grey wave in the Triangle pattern) is also a strong key showing that the Triangle has ended, and the fifth wave after the Triangle is ready to unfold.
Invalidation point: 31.59.
Confirmation point: 33.60.
Conclusion
Our analysis, forecast of contextual trends, and short-term outlook for ASX: WESTPAC BANKING CORPORATION - WBC aim to provide readers with insights into the current market trends and how to capitalize on them effectively. We offer specific price points that act as validation or invalidation signals for our wave count, enhancing the confidence in our perspective. By combining these factors, we strive to offer readers the most objective and professional perspective on market trends.
Westpac Banking Corporation Elliott Wave analysis [Video]
Author

Peter Mathers
TradingLounge
Peter Mathers started actively trading in 1982. He began his career at Hoei and Shoin, a Japanese futures trading company.


