VIX breakout and 10YR yield collapse trigger market chaos: What's next for stocks?

"Explosive divergence between VIX and 10YR yield sparks volatility surge, signaling significant downside risks for Nasdaq, S&P 500, and Dow. Is this the start of a deeper market correction?"
VIX and 10YR yield divergence explodes, triggering chaos in US markets
The divergence between the Volatility Index (VIX) and the 10-year Treasury yield (10YR) has reached a critical tipping point, causing significant market turmoil. As highlighted in our March 28th, 2025 analysis, the stock market was already under pressure, with major indices in decline and the VIX preparing for an imminent breakout, while the 10YR yield showed signs of a reversal. As of April 3rd, 2025, the VIX pierced through its critical resistance trendline, confirming expectations and triggering an explosive 50% rise on April 4th, closing at 45. This dramatic surge echoes the volatility spike witnessed last in August 2024.
This explosion in the VIX, paired with a sharp drop in the 10YR yield, has further amplified concerns about the broader market's stability. The dynamics between these two key indicators are critical to understanding the current chaos unfolding in US equities.
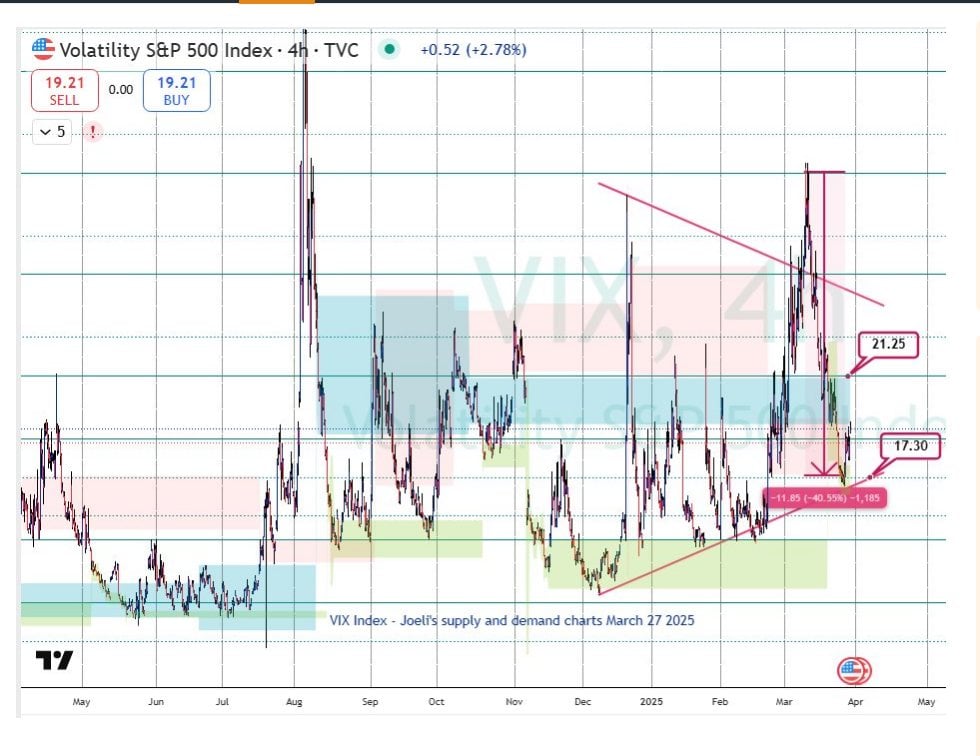
VIX March 2025 analysis
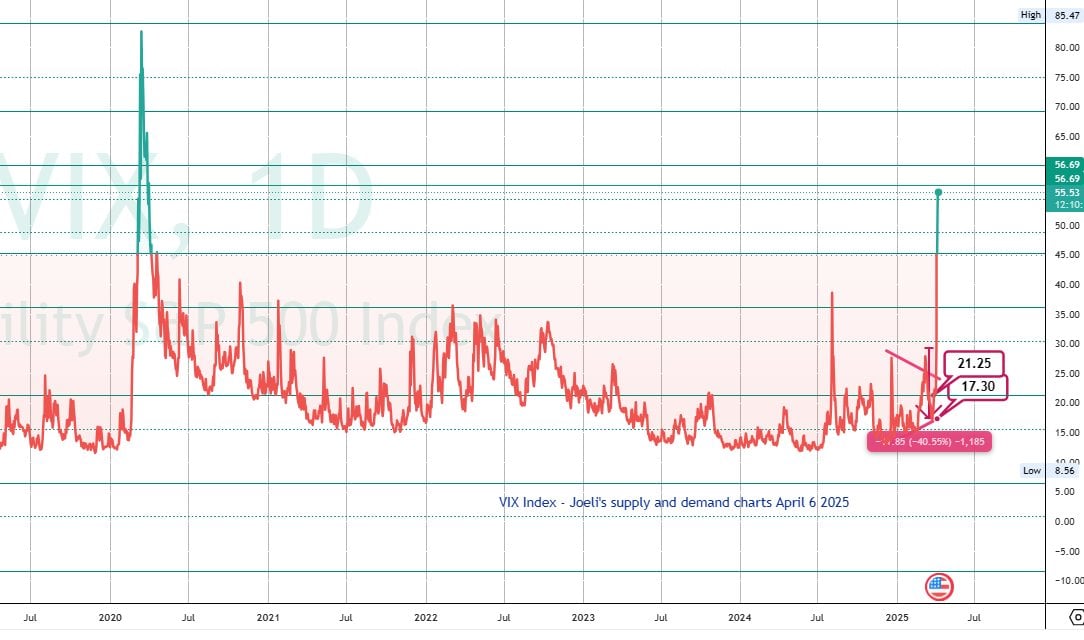
VIX April 6 2025 analysis
Short-term market impact:
The short-term technicals are already showing significant fallout from the VIX breakout. With the VIX now at 45, it is poised to test higher targets at 46.76, 50.75, 53.22, and 57 if the 45 level holds. However, a retreat from 45 would bring potential support at 41.25, 37.26, and 34.80.
The 10YR yield's decline has also been sharp, breaking through the 4.16% level and hitting critical targets at 4% and 3.90%. The key support now lies at 3.90%, with any failure to hold this level potentially leading to further declines toward 3.70%, 3.62%, and a major target of 3.32%.
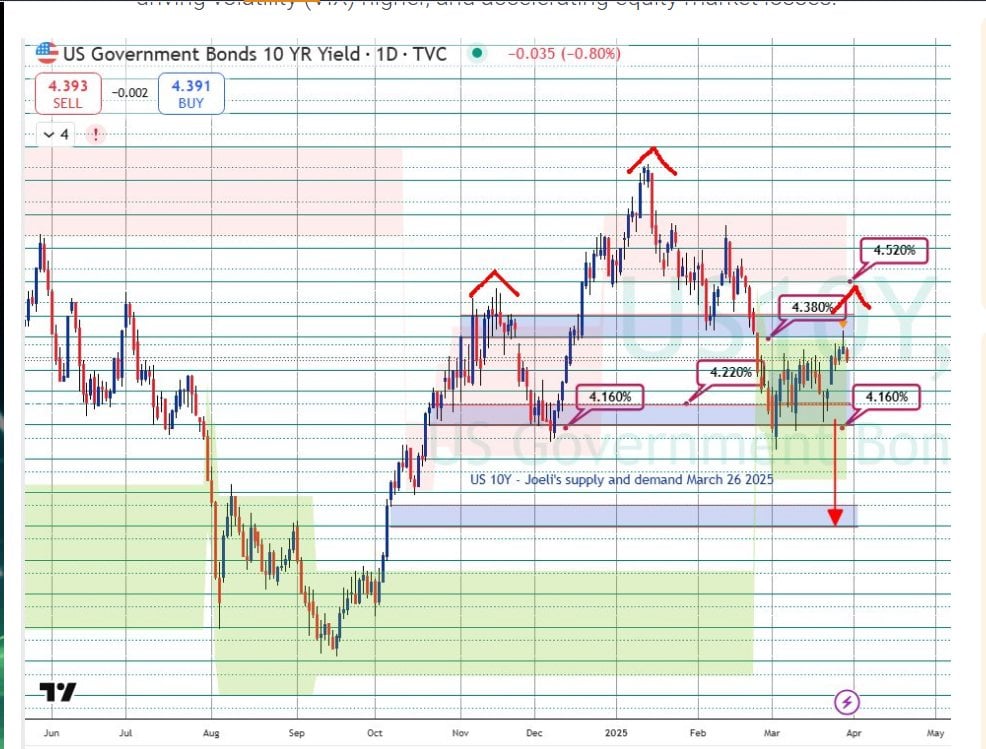
10YR Yield March 2025 analysis
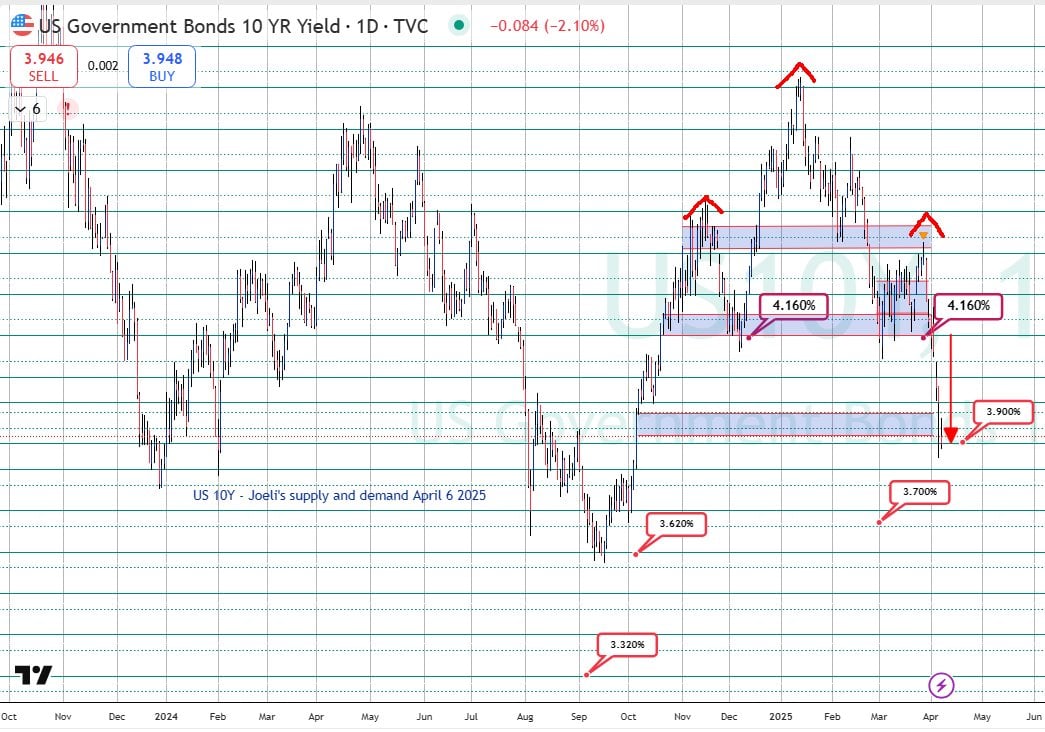
10YR Yield April 2025 analysis
In terms of equity indices:
-
Nasdaq Futures have dropped to 16,540. If the 16,480 level is breached, the next key supports are at 16,096, 15,714, and the major target at 15,330.
-
S&P 500 Futures have fallen to 4,860. If this support level is lost, declines toward 4,772, 4,682, and the major target at 4,592 are likely. Rebound attempts at 4,860 will face resistance at 4,917, 4,952, and 5,000.
-
Dow Futures are trading at 36,928, with critical support at 36,667. A breakdown below this level would see the Dow heading to 36,409, 35,990, and the major target at 35,315. Resistance is found at 37,085, 37,348, and 37,761.
Long-term market implications:
The longer-term implications of this divergence and subsequent breakout are potentially more severe. The VIX's surge above 45 signals heightened risk aversion and an increase in market volatility, which could linger for an extended period, especially if economic and inflationary pressures remain elevated. As we have seen historically, VIX levels above 45 often correlate with periods of significant market stress.
On the fundamental side, the collapse in the 10YR yield reflects deteriorating investor sentiment and growing concerns about economic growth, inflation persistence, and potential policy missteps. With the yield hitting the critical 3.90% level and heading toward lower targets, this suggests that bond investors are increasingly seeking safety, a sign of mounting recession fears. This aligns with the growing anxiety in the equity markets, where stock valuations are under pressure due to rising uncertainty and the possibility of weaker economic growth.
The market's struggle to stabilize amid the sharp moves in both the VIX and the 10YR yield underscores the fragility of investor confidence. A prolonged period of high volatility, accompanied by a persistent decline in yields, could signal a protracted period of market weakness, with continued downside risks for major indices.
Conclusion
The market is navigating a critical inflexion point, where the divergence between the VIX and the 10YR yield has exploded, pushing the markets into turmoil. The short-term outlook remains volatile, with significant support and resistance levels in place across the major indices. The long-term picture is one of heightened uncertainty, where the combination of rising volatility and declining yields points to deepening investor concerns about the economic trajectory.
Investors should remain vigilant, as the current market dynamics suggest that volatility could persist, with further downside risks in both equities and yields. A decisive break in key levels across the VIX and Treasury yields will likely set the tone for the next phase of the market, with a bearish continuation scenario still dominant.
Author

Denis Joeli Fatiaki
Independent Analyst
Denis Joeli Fatiaki possesses over a decade of extensive experience as a multi-asset trader and Market Strategist.


