|

Vertiv Holdings (VRT) eyes next rally from blue box area

Vertiv Holdings Co., is an American multinational provider of critical infrastructure & services for data centers, communication networks & commercial & industrial environments. It comes under Industrials sector & trades as “VRT” ticket for NYSE.

As expected in the previous article, VRT ended impulse sequence (I) at $155.84 high in January-2025. Below there, it favors zigzag correction in (II) towards $68.08 – $31.94 area before next rally. It reached the daily blue box area & should continue rally against $31.94 low.

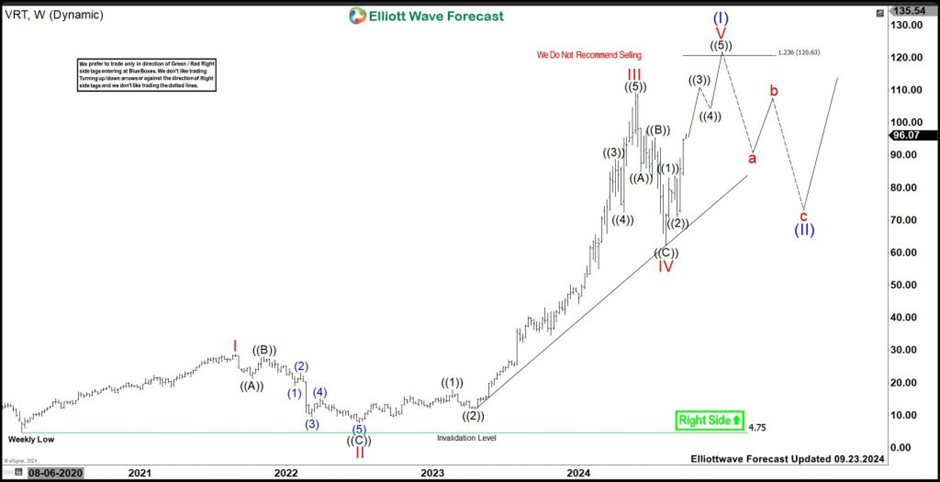
VRT – Elliott Wave latest weekly view

Chart

In weekly, it favors (II) pullback in 3 swings pullback & buyers should take control soon. It placed I at $28.80 high in August-2021 & II as flat correction at $7.76 low in July-2022. Above that low, it resumed higher in extended III sequence, which ended at $109.27 high in May-2024. Within III, it placed ((1)) at $17.88 high, ((2)) at $11.95 low, ((3)) at $88.69 high, ((4)) at $72.58 low & finally ended ((5)) at $109.27 high as III. It ended IV as zigzag correction at $62.40 low & V as (I) at $155.84 high.

VRT – Elliott Wave latest daily view

Chart

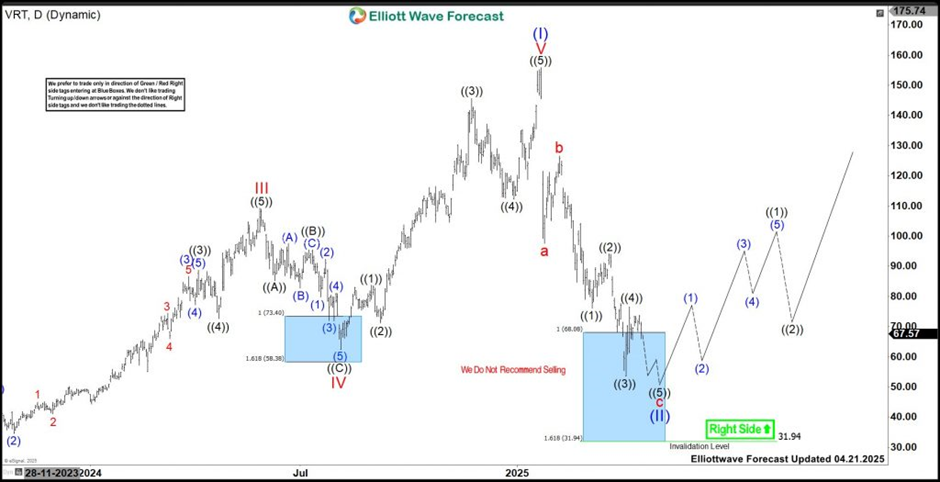
Below (II) low, it favors lower in c & expect to break below 4.07.2025 low to finish the correction. Within (II), it placed a at $97.50 low & b at $126.53 high. It placed ((1)) of c at $76.10 low, ((2)) at $94.20 high, ((3)) at $53.60 low, ((4)) at $76.49 high & favors downside in ((5)). It expects ((5)) to extend towards $48.12 – $36.25 area to finish c in zigzag correction. We like to remain long from daily blue box area against $31.94 low for next move higher. It should continue rally later in (III) or at least larger 3 swing bounce.

VRT – Elliott Wave view from 9.23.2024

Chart

Author

Elliott Wave Forecast Team

Elliott Wave Forecast Team

ElliottWave-Forecast.com

More from Elliott Wave Forecast Team
Share:

Editor's Picks

EUR/USD deflates to fresh lows, targets 1.1600

The selling pressure on EUR/USD now gathers extra pace, prompting the pair to hit fresh multi-week lows in the 1.1625-1.1620 band on Friday. The continuation of the downward bias comes in response to further gains in the US Dollar as market participants continue to assess the mixed release of US Nonfarm Payrolls in December.

GBP/USD breaks below 1.3400, challenges the 200-day SMA

GBP/USD remains under heavy fire and retreats for the fourth consecutive day on Friday. Indeed, Cable suffers the strong performance of the Greenback, intensified post-mixed NFP, and trades at shouting distance from its critical 200-day SMA near 1.3380.

Gold flirts with yearly tops around $4,500

Gold keeps its positive bias on Friday, adding to Thursday’s advance and challenging yearly highs in the $4,500 region per troy ounce. The risk-off sentiment favours the yellow metal despite the firmer tone in the Greenback and rising US Treasury yields.

Crypto Today: Bitcoin, Ethereum, XRP risk further decline as market fear persists amid slowing demand

Bitcoin holds $90,000 but stays below the 50-day EMA as institutional demand wanes. Ethereum steadies above $3,000 but remains structurally weak due to ETF outflows. XRP ETFs resume inflows, but the price struggles to gain ground above key support.

Week ahead – US CPI might challenge the geopolitics-boosted Dollar

Geopolitics may try to steal the limelight from US data. A possible US Supreme Court ruling on tariffs could dictate market movements. A crammed data calendar next week, US CPI comes on Tuesday; Fedspeak to intensify.

XRP trades under pressure amid weak retail demand

XRP presses down on the 50-day EMA support as risk-averse sentiment spreads despite a positive start to 2026. XRP faces declining retail demand, as reflected in futures Open Interest, which has fallen to $4.15 billion.