$UTDI: Technology stock United Internet towards buying area

United Internet AG is a global internet services company. Founded 1988, headquartered in Montabaur, Germany, and traded under the ticker $UTDI in Frankfurt, it is a component of the TecDax index. First of all, United Internet comprises two units, Access and Applications. In particular, it owns the leading internet service providers in Germany as well as major email providers such as GMX, mail.com and web.de. In total, it has 16 brands and numerous subsidiaries. Also, company operates its own internet backbone. 2020, as a matter of fact, we saw technology stocks leading the rally in US. For the years 2023-2024, we expect the rally to continue. Hereby, United Internet as a heavyweight in Tec DAX should become an excellent opportunity for technology oriented investors.
In the initial article from September 2020, we have forecasted the end of the initial advance from March 2020 lows and a consolidation lower. Indeed, the drop off August 2020 peak has initiated the correction. Here, we provide an update including the next area where investors and traders should be waiting to enter the market for the long side.
United Internet monthly Elliott Wave analysis 07.19.2022
The monthly chart below shows the United Internet shares $UTDI traded at Frankfurt Stock Exchange. From the all-time lows, the stock price has developed a cycle higher in wave (I) towards 17.46 highs on November 2007. After the primary impulse higher, a correction lower in wave (II) has ended on November 2008 at 4.16.
From the November 2008 lows, a new cycle has started breaking the 17.46 highs. The red wave I has ended in December 2015 at 51.94. Hereby, within the impulsive advance, all the subwaves ((1)), ((3)) and ((5)) are impulsive waves, too. Wave ((3)) demonstrates a clear extension in price. From the December 2015 highs, a correction in wave II has unfolded as an expanded flat pattern. To recall, expanded flats are corrective structures which do, however, print a new high in price. As a matter of fact, we saw the all-time highs in wave ((B)) of II in January 2018 at 59.80. From there, the wave ((C)) has accomplished the pattern by printing the low in March 2020 at 20.76.
From the March lows, a new cycle in wave III of (III) may have started to the new highs. Break of 51.94-59.80 would confirm that. As of right now, the price action is showing a formation of first nest being black waves ((1))-((2)). Once finished and while above 20.76 lows, one should expect another extension higher in wave ((3)) of III. Long-term target for wave III will be 68.53-98.05 area and even beyond.

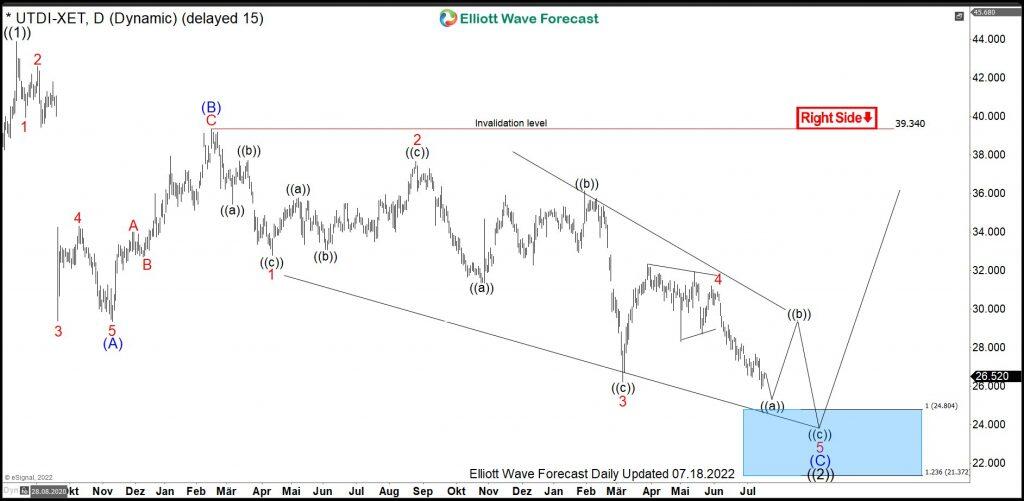
United Internet daily Elliott Wave analysis 07.19.2022
The Daily chart below shows the $UTDI shares price action in more detail. First, the cycle from March 2020 lows in black wave ((1)) has printed a top in August 2020 at 43.88. From the highs, a consolidation lower in wave ((2)) has started and is still in progress. The pattern of the pullback is an Elliott wave zigzag being a 5-3-5 structure. First, an impulse in blue wave (A) has ended in November 2020 at 29.35. Then, a connector in wave (B) has accomplished in February 2021 at 39.34. From there, wave (C) has broken below 29.35. As a matter of fact, that move has opened a bearish sequence. The target for a diagonal move in wave (C) is 24.80-20.76. Investors and traders should be looking to buy $UTDI from that area expecting acceleration higher within black wave ((3)) of red wave III.
As an outlook, the new cycle in red wave III should bring the prices towards 51.94-59.80 and above. The target for wave III will be 68.53-98.05 area and even higher.
Author

Elliott Wave Forecast Team
ElliottWave-Forecast.com


