|

USDJPY Price Analysis: Supported around 140.00, as bull’s eye 141.00

  • USDJPY prepares to finish the week with gains of more than 1%.
  • Even though the USDJPY plunged towards 137.50s, the bias remains upward.
  • USDJPY Price Analysis: Break below 137.50, a fall to the 200-DMA is on the cards; otherwise, the 100-DMA is eyed.

The USDJPY is set to finish the week almost flat, dropping in the last week from around 147.00 to 138.46, after the release of a soft inflation report in the United States (US), sparking speculations that the Federal Reserve (Fed) might stop from rising rates. However, in the present week, the USDJPY is staging a recovery. At the time of writing, the USDJPY is trading at 140.37.

USDJPY Price Analysis: Technical outlook

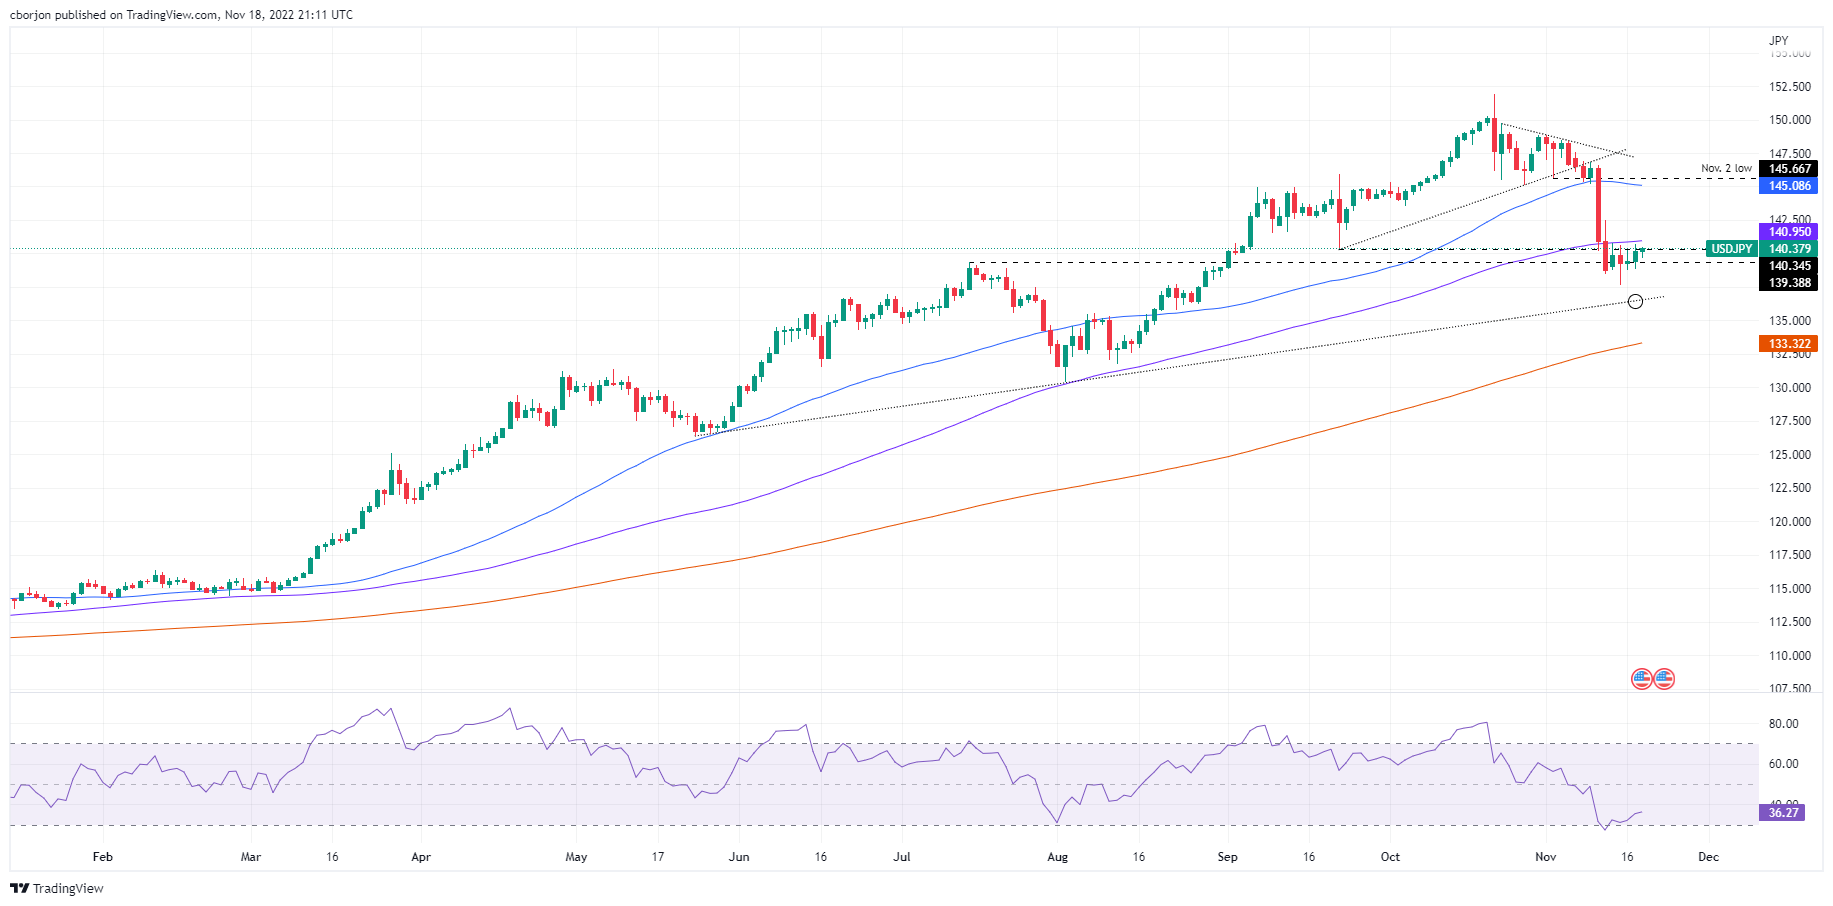
Albeit tumbling in the last week close to 5%, the USDJPY remains upward biased. At the time of typing, the USDJPY sits comfortably above 140.00. Nevertheless, the USDJPY could not crack the 100-day Exponential Moving Average (EMA) at 140.95, which could have exacerbated a rally toward the November 11 daily high at 142.48. It should be noted that the Relative Strength Index (RSI) exited from oversold territory, suggesting that USDJPY buyers are outpacing sellers.

On the downside, the USDJPY key support levels are the September 22 swing low at 140.34, followed by this week’s low, November 15 at 137.65. Upwards, the USDJPY key resistance levels lie at the 100-day EMA at 140.95, followed by 142.48, followed by the 50-day EMA at 145.08.

,

USDJPY Key Technical Levels

USD/JPY

Overview
Today last price140.4
Today Daily Change0.21
Today Daily Change %0.15
Today daily open140.19
 
Trends
Daily SMA20145.07
Daily SMA50145.13
Daily SMA100140.91
Daily SMA200133.22
 
Levels
Previous Daily High140.74
Previous Daily Low138.88
Previous Weekly High147.57
Previous Weekly Low138.47
Previous Monthly High151.94
Previous Monthly Low143.53
Daily Fibonacci 38.2%140.03
Daily Fibonacci 61.8%139.59
Daily Pivot Point S1139.13
Daily Pivot Point S2138.07
Daily Pivot Point S3137.26
Daily Pivot Point R1141
Daily Pivot Point R2141.8
Daily Pivot Point R3142.86

Author

Christian Borjon Valencia

Markets analyst, news editor, and trading instructor with over 14 years of experience across FX, commodities, US equity indices, and global macro markets.

More from Christian Borjon Valencia
Share:

Editor's Picks

EUR/USD holds above 1.1750 after mixed EU PMI data

EUR/USD manages to hold above 1.1750 but struggles to gather recovery momentum on Friday, following the mixed February PMI figures from Germany and the Eurozone. In the second half of the day, Q4 GDP, December inflation and February PMI data from the US will be watched closely by market participants.

GBP/USD recovers further toward 1.3500 after UK PMI data

GBP/USD is recovering ground further toward 1.3500 in European trading on Friday, helped by a modest uptick in the Pound Sterling after stronger-than-expected UK January Retail Sales and February PMI data. However, the pair's further upside could be limited amid persistent US Dollar strength as the focus turns to key US data. 

Gold sticks to positive bias above $5,000 ahead of US data

Gold gains some positive traction for the third consecutive day on Friday. holding above $5,000. Traders now look forward to the key US macro releases – the Advance Q4 GDP report and the Personal Consumption Expenditures (PCE) Price Index – for fresh trading impetus. 

US GDP growth expected to slow down significantly in Q4 after stellar Q3 

The United States Bureau of Economic Analysis will publish the first preliminary estimate of the fourth-quarter Gross Domestic Product at 13:30 GMT. Analysts forecast the US economy to have expanded at a 3% annualized rate, slowing down from the 4.4% growth posted in the previous quarter.

Iran tensions and AI fears at the forefront ahead of key US data

Thursday’s scorecard shows major US Stock benchmarks closed modestly in the red amid mounting US-Iran tensions and AI disruption worries. The S&P 500 shed 19 points (0.3%) to 6,861, the Nasdaq 100 lost 101 points (0.4%) to 24,797, and the Dow Jones Industrial Average dropped 267 points (0.5%) to 49,395.

Official Trump price approaches breakout with mixed signals from traders

Official Trump (TRUMP) is trading at $3.50 at the time of writing, approaching its upper consolidation range. A breakout from this range could open the door for an upside move. On-chain data shows market indecision, with balanced flows between bulls and bears, signaling a lack of clear directional bias.