|

USDJPY Price Analysis: Plummets below the 100-DMA and hits a fresh 2-month low

  • The USDJPY is set to finish the week with losses of more than 5%.
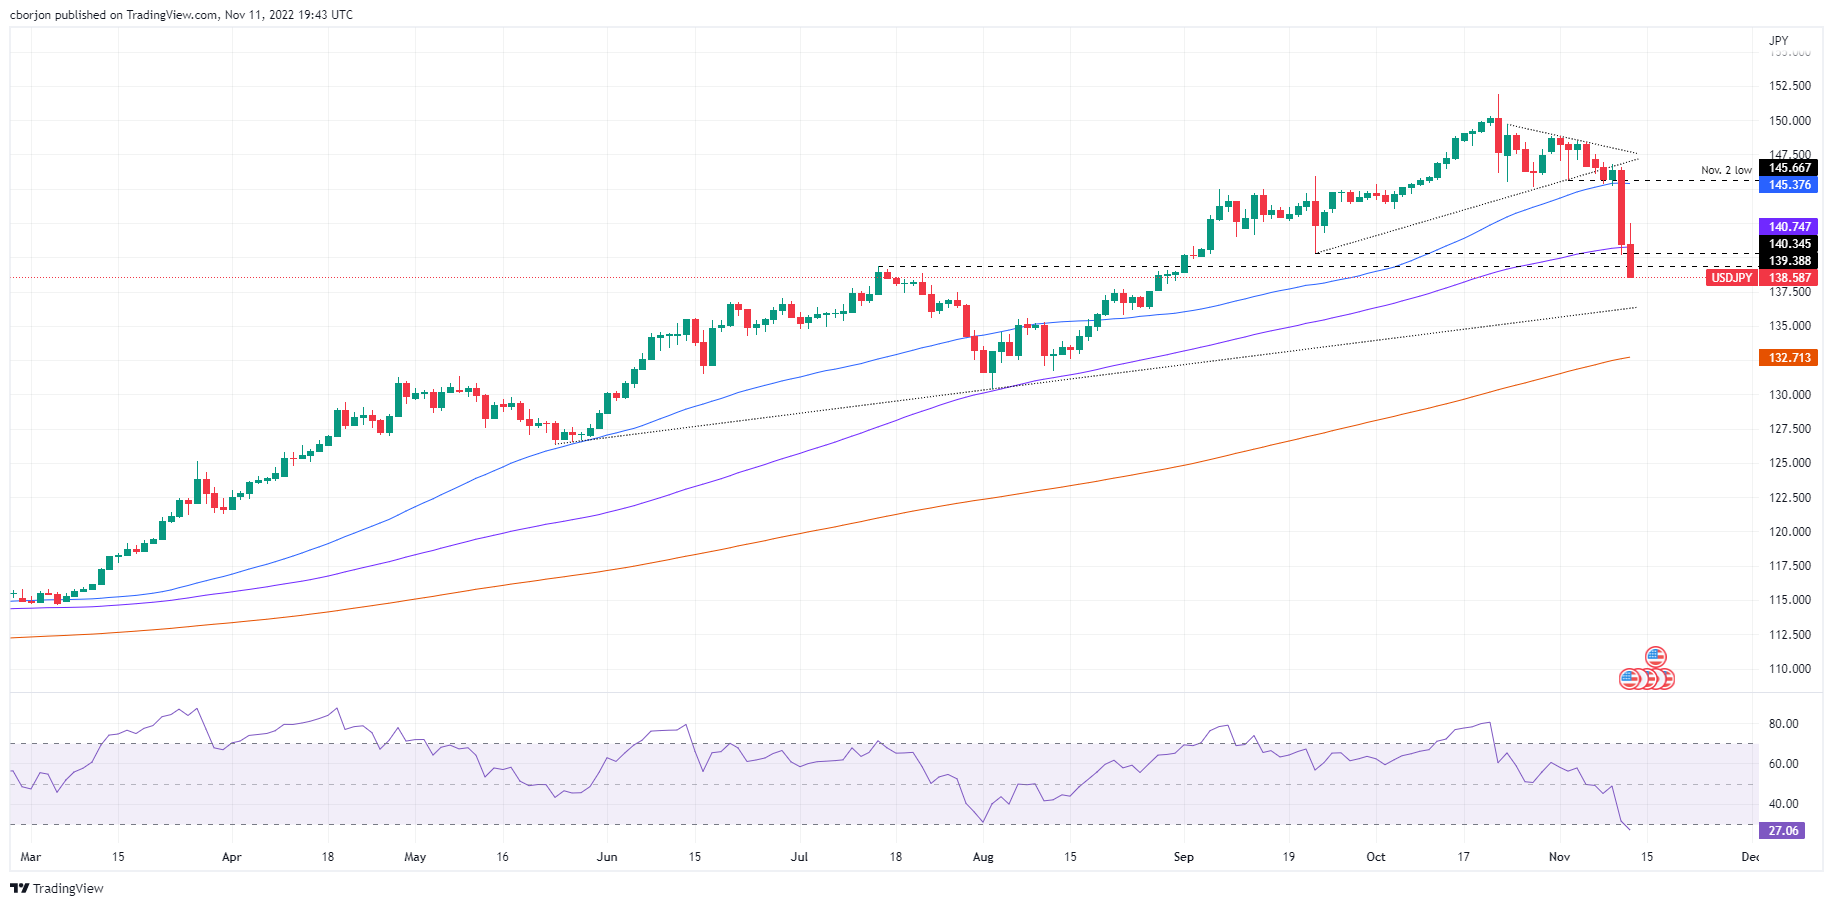
  • From a daily chart perspective, the USDJPY is neutral-to-downward biased if the major stays below the 100-day EMA.

The USDJPY extended its free fall and plummeted another 200 plus pips on Friday, below the 100-day Exponential Moving Average (EMA) at 140.76. Speculations that the Federal Reserve might slow the pace of rate hikes and US Treasury yields falling are the two main factors weighing on the US Dollar (USD). Therefore, the USDJPY is trading at 138.54, below its opening price by 1.73%.

USDJPY Price Analysis: Technical outlook

The USDJPY portrays that Thursday’s price action broke a one-month-old upslope support trendline, exacerbating a fall toward the 100-day EMA at 140.74. On Friday, the USDJPY hit a daily high at around 142.50 before diving sharply, as buyers failed to clear the September 22 swing low at 140.34, which shifted the pair’s bias from neutral to neutral downwards. The Relative Strength Index (RSI) tumbled toward the bearish territory, entering oversold conditions.

Even though the USDJPY cleared key support levels, a break of the 200-day EMA is needed so that Japanese Yen (JPY) buyers could be in charge. Otherwise, the USDJPY might be subject to buying pressure.

Therefore, the USDJPY first support would be the 138.00 figure. Break below will expose the 137.50 psychological level, followed buy a six-month-old upslope trendline that passes around 136.50, ahead of the 136.00 mark.

On the flip side, the USDJPY's first resistance would be the July 14 daily high at 139.38, followed by the psychological 140.00, ahead of the 100-day EMA.

USDJPY Key Technical Levels

USD/JPY

Overview
Today last price138.55
Today Daily Change-2.68
Today Daily Change %-1.90
Today daily open141.23
 
Trends
Daily SMA20147.57
Daily SMA50145.42
Daily SMA100140.73
Daily SMA200132.62
 
Levels
Previous Daily High146.59
Previous Daily Low141.2
Previous Weekly High148.85
Previous Weekly Low145.67
Previous Monthly High151.94
Previous Monthly Low143.53
Daily Fibonacci 38.2%143.26
Daily Fibonacci 61.8%144.53
Daily Pivot Point S1139.42
Daily Pivot Point S2137.62
Daily Pivot Point S3134.03
Daily Pivot Point R1144.81
Daily Pivot Point R2148.39
Daily Pivot Point R3150.2

Author

Christian Borjon Valencia

Christian Borjon began his career as a retail trader in 2010, mainly focused on technical analysis and strategies around it. He started as a swing trader, as he used to work in another industry unrelated to the financial markets.

More from Christian Borjon Valencia
Share:

Markets move fast. We move first.

Orange Juice Newsletter brings you expert driven insights - not headlines. Every day on your inbox.

By subscribing you agree to our Terms and conditions.

Editor's Picks

EUR/USD flatlines below 1.1800 ahead of Fed Minutes

EUR/USD struggles to find direction and continues to move sideways below 1.1800 for the second consecutive day on Tuesday as markets remain in holiday mood. Later in the American session, the Federal Reserve will publish the minutes of the December policy meeting.

GBP/USD retreats to 1.3500 area following earlier climb

GBP/USD loses its traction and trades flat on the day near 1.3500 after rising to the 1.3530 area early Tuesday. Trading conditions remain thin ahead of the New Year holiday, limiting the pair's volatility. The Fed will publish December meeting minutes in the late American session.

Gold rebounds toward $4,400 following sharp correction

Gold gathers recovery momentum and advances toward $4,400 on Tuesday after losing more than 4% on Monday. Increased margin requirements on gold and silver futures by the Chicago Mercantile Exchange Group, one of the world’s largest trading floors for commodities, prompted widespread profit-taking and portfolio rebalancing.

Tron steadies as Justin Sun invests $18 million in Tron Inc.

Tron (TRX) trades above $0.2800 at press time on Monday, hovering below the 50-day Exponential Moving Average (EMA) at $0.2859.

Economic outlook 2026-2027 in advanced countries: Solidity test

After a year marked by global economic resilience and ending on a note of optimism, 2026 looks promising and could be a year of solid economic performance. In our baseline scenario, we expect most of the supportive factors at work in 2025 to continue to play a role in 2026.

Crypto market outlook for 2026

Year 2025 was volatile, as crypto often is.  Among positive catalysts were favourable regulatory changes in the U.S., rise of Digital Asset Treasuries (DAT), adoption of AI and tokenization of Real-World-Assets (RWA).