USD/ZAR Price Analysis: Wednesday's Doji cools down recovery hopes
- USD/ZAR prints mild losses after bouncing off late-February lows in early week.
- Trend reversal suggesting candlestick formation joins bearish MACD to favor sellers.
- Previous support stretched from July 21, falling trend line from late-September add to the upside barriers.
USD/ZAR wavers around 15.64 during early Thursday. The pair dropped the lowest since late-February on Monday while extending the downside break of a multi-day-old support line, now resistance, on November 05.
The following pullback, marked Tuesday, couldn’t get credits yesterday as USD/ZAR traders jostled around 15.63/65. While the same portrayed a Doji candlestick on the daily chart, bearish MACD and a sustained trend line break back the bears.
As a result, the recent low near 15.52 holds the key to the pair’s fresh downside towards 15.34 and the multi-day bottom flashed earlier in the week close to 15.21. However, the 15.00 round-figure may probe any further downside.
Meanwhile, bulls need to cross the previous support around 15.85 to recover some of the losses. Though, the 16.00 threshold and a falling resistance line from September 25, at 16.25 could challenge the USD/ZAR buyers afterward.
Should there be a clear upside past-16.25, the monthly high near 16.45, followed by late-October tops near 16.50, will act as upside hurdles.
USD/ZAR daily chart
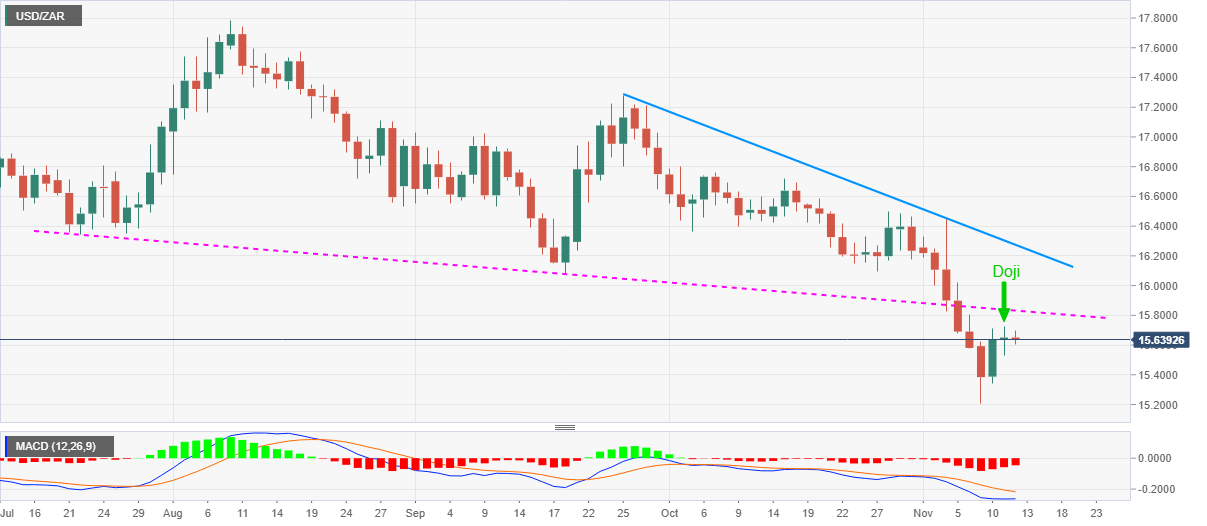
Trend: Bearish
Author

Anil Panchal
FXStreet
Anil Panchal has nearly 15 years of experience in tracking financial markets. With a keen interest in macroeconomics, Anil aptly tracks global news/updates and stays well-informed about the global financial moves and their implications.


