USD/ZAR Price Analysis: Probes 100-day SMA support
- USD/ZAR charted a bearish inverted hammer on Monday.
- The pair flirts with a key SMA support during Tuesday's Asian trading hours.
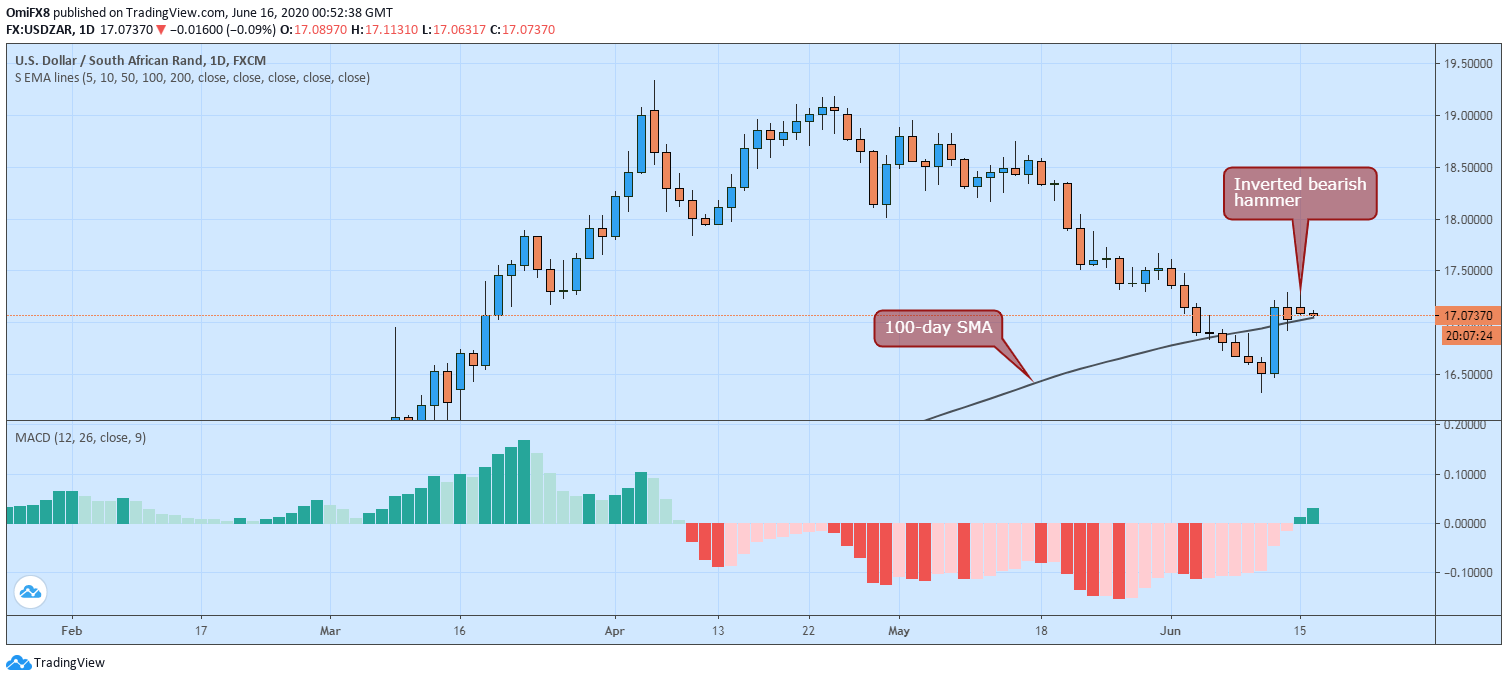
South African Rand is looking to extend overnight gains against the US dollar, but so far, the USD/ZAR pair has struggled to penetrate the 100-day simple moving average (SMA) support at 17.0486.
Technical charts are reporting conflicting signals. For instance, Monday's inverted bearish hammer suggests that the bounce from the June 10 low of 16.32 has ended and the bears have regained control.
However, the MACD histogram, which is used to identify trend reversal and trend changes, has crossed above zero, indicating a bullish reversal. The MACD, however, is based on backward-looking moving averages and tends to lag prices.
The bearish candlestick pattern, therefore, takes precedence over the MACD histogram. The 100-day SMA support, if breached, would open the doors to re-test of the June 11 low of 16.47. On the higher side, the high of Monday's inverted bearish hammer candle at 17.3428 is the level to beat for the bulls.
Daily chart
Trend: Bearish
Technical levels
Author

Omkar Godbole
FXStreet Contributor
Omkar Godbole, editor and analyst, joined FXStreet after four years as a research analyst at several Indian brokerage companies.


