USD/TRY Price Analysis: Struggles for a firm direction, stuck in a range above 200-hour SMA
- USD/TRY extends its consolidative price move and remains confined in a range.
- The technical setup supports prospects for some meaningful appreciating move.
- A break below the ascending trend-line support will negate the positive outlook.

The USD/TRY pair struggles to capitalize on the overnight goodish rebound from the 26.15 area, or a four-day low and oscillates in a narrow band through the Asian session on Tuesday. Spot prices currently trade just above the 26.75 region, nearly unchanged for the day.
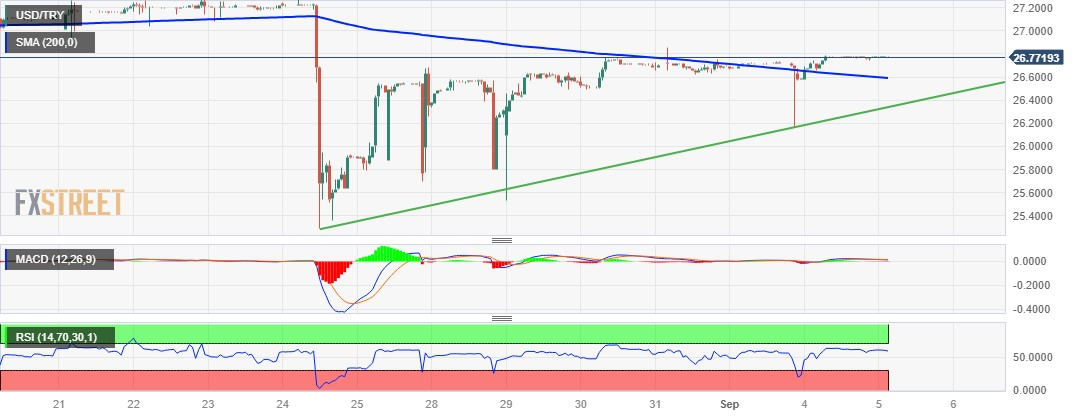
From a technical perspective, the recent recovery from the 25.30 zone, or a nearly two-month low touched in August, has been along an upward-sloping sloping trend-line. Moreover, the USD/TRY pair now seems to have found acceptance above the 200-houe Simple Moving Average (SMA), which, along with positive oscillators on daily/hourly charts, supports prospects for some meaningful appreciating move.
Hence, a subsequent move up, back towards reclaiming the 27.00 round-figure mark, looks like a distinct possibility. Some follow-through buying beyond the next relevant hurdle near the 27.25 region should allow the USD/TRY pair to aim back to challenge the all-time high, around the 27.85-27.90 zone set in August. This is followed by the 28.00 mark, which if cleared will be seen as a fresh trigger for bullish traders.
On the flip side, the 26.55-26.50 area, or the 200-hour SMA, could protect the immediate downside ahead of the aforementioned trend-line support, currently around the 26.35 region. The latter should act as a pivotal point, which if broken decisively might shift the bias in favour of bears. Some follow-through selling below the overnight swing low, around the 26.15 region, will reaffirm the negative outlook.
The USD/TRY pair might then turn vulnerable to weaken further below the 26.00 mark and accelerate the downfall towards the 25.70-25.65 intermediate support en route to mid-25.00s and the August monthly swing low, around the 25.30 region.
USD/TRY 1-hour chart
Author

Haresh Menghani
FXStreet
Haresh Menghani is a detail-oriented professional with 10+ years of extensive experience in analysing the global financial markets.