USD/TRY Price Analysis: Rising wedge at record top tests bulls above $14.00
- USD/TRY prints mild losses as bulls take a breather around record top.
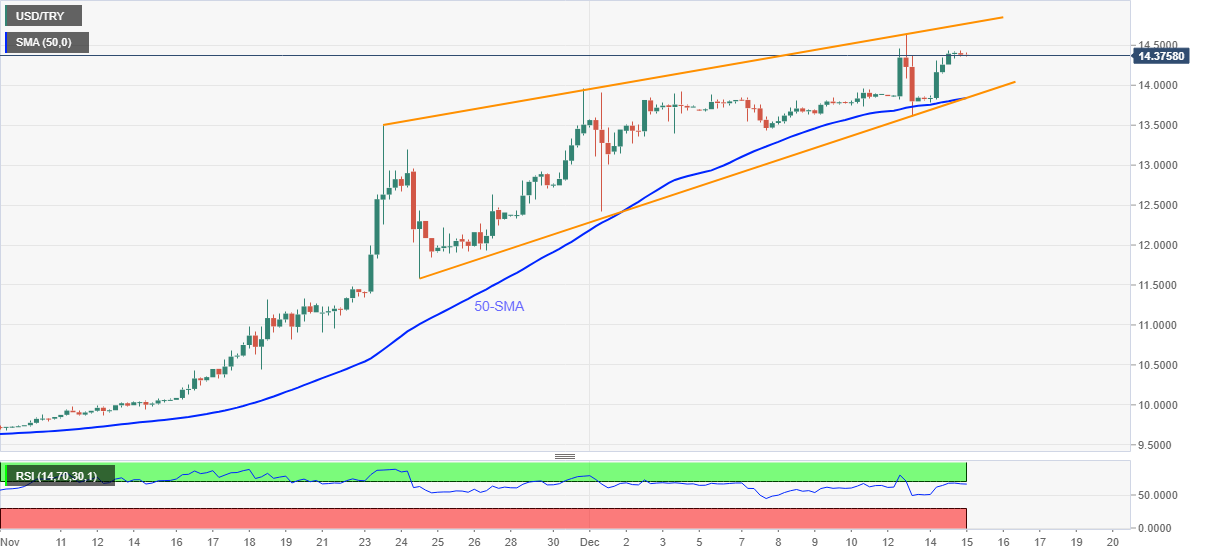
- Bearish chart pattern, RSI pullback from overbought territory favor short-term sellers.
- 50-SMA adds strength to the wedge’s support line.

USD/TRY prices drop 0.15% intraday to $14.37 during early Tuesday, after refreshing the all-time high with $14.64 level the previous day. In doing so, the Turkish lira (TRY) pair tracks RSI pullback from oversold territory.
The latest weakness, or consolidation of the gains, is likely to stretch towards the $14.00 threshold. However, any further weakness will be challenged by the $13.84 key support confluence, including 50-SMA and the lower line of a three-week-old rising wedge.
Should the quote drops below $13.84, it confirms a theoretical downward trajectory towards the late November lows around $11.57.
During the anticipated fall, $12.40 and the $12.00 threshold may offer an intermediate halt.
Meanwhile, further upside needs to cross the stated wedge’s resistance line, near $14.77 at the latest, before directing the USD/TRY bulls towards the $15.00 threshold.
USD/TRY: Four-hour chart
Trend: Pullback expected
Author

Anil Panchal
FXStreet
Anil Panchal has nearly 15 years of experience in tracking financial markets. With a keen interest in macroeconomics, Anil aptly tracks global news/updates and stays well-informed about the global financial moves and their implications.


