USD/TRY Price Analysis: Monday’s gravestone doji keeps bulls hopeful
- USD/TRY snaps two-day weakness despite stays below 50-day SMA.
- Bullish candlestick formation joins upbeat MACD signals to favor the buyers.
- Sellers need to conquer 100-day SMA for entries.

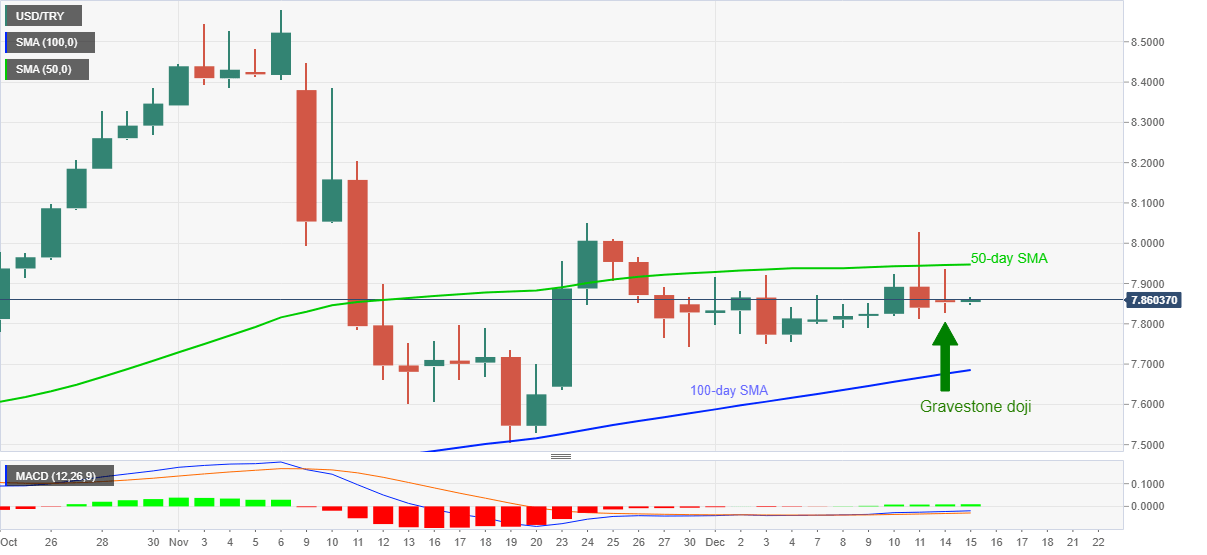
USD/TRY seesaws near the intraday high of 7.8671, currently around 7.8581, during the early Tuesday. The pair marked another daily closing below 50-day SMA but flashed gravestone doji candlestick formation on D1 play the previous day.
The likely upside momentum gains clues from the quote’s sustained trading beyond 100-day SMA and bullish MACD.
However, a successful break above 50-day SMA, at 7.9475 now, becomes necessary to recall the bull targeting the late-November top near 8.0510.
Meanwhile, USD/TRY sellers need to refresh the monthly bottom near 7.7520 before targeting the 100-day SMA level of 7.6850.
Overall, the quote gradually gains the upside momentum and hence bears should remain cautious.
USD/TRY daily chart
Trend: Further upside expected
Author

Anil Panchal
FXStreet
Anil Panchal has nearly 15 years of experience in tracking financial markets. With a keen interest in macroeconomics, Anil aptly tracks global news/updates and stays well-informed about the global financial moves and their implications.


