USD/TRY Price Analysis: Consolidates losses around four-month low, bears in control
- USD/TRY eases from intraday top, snaps three-day downtrend.
- Monthly falling trend line, sustained break of 100-day EMA favor sellers.
- 61.8% Fibonacci retracement, two-week-old resistance line guard immediate upside, RSI conditions hint at a corrective pullback.
USD/TRY keeps bounce off the lowest since May 10, despite easing of late, up 0.10% intraday around $8.2850 as European traders brush their screens for the key Friday.
In addition to the widely chattered US Nonfarm Payrolls (NFP), Turkish Consumer Price Index (CPI) data for August, expected to ease to 0.6% MoM versus 1.8% prior, also becomes important for the pair traders.
Technically, nearly oversold RSI conditions back the pair’s latest corrective pullback. However, downward sloping trend lines from August 11 and 20, respectively around $8.3300 and $8.3840, join clear trading below 100-day EMA, around $8.3840, to keep the bears hopeful.
It’s worth noting that the recovery moves will also find a 61.8% Fibonacci retracement level of April–June upside, near $8.3155, as an immediate hurdle.
Meanwhile, May’s monthly low of $8.2160 and the late April bottom surrounding $8.1300 challenge the quote’s short-term downside.
In a case where USD/TRY keeps reins past $8.1300, the $8.100 threshold and April 15 low of $8.0130 should return to the charts.
USD/TRY: Daily chart
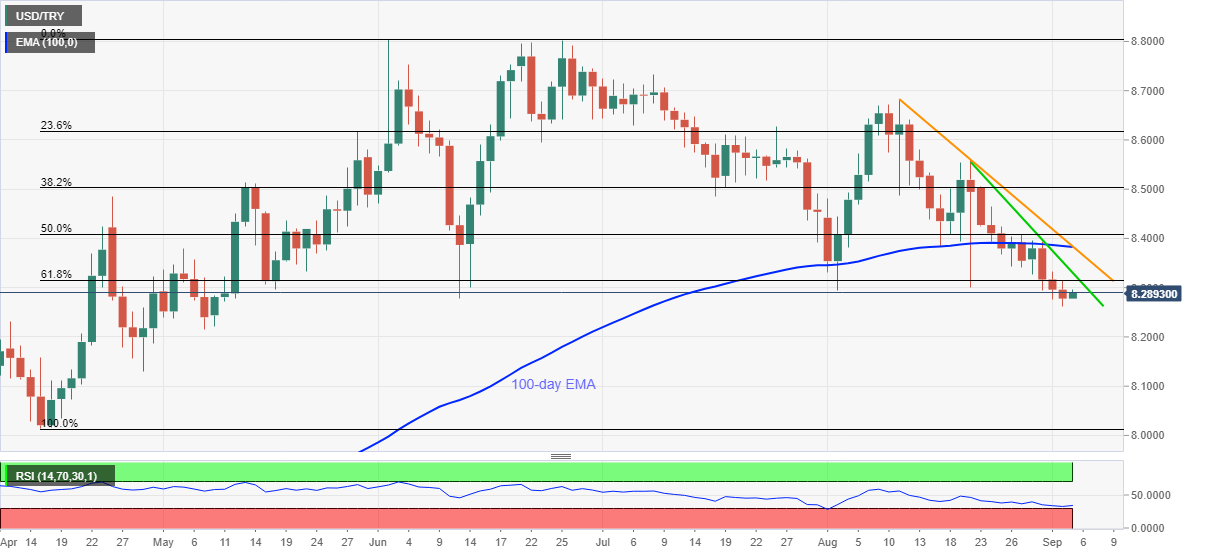
Trend: Bearish
Author

Anil Panchal
FXStreet
Anil Panchal has nearly 15 years of experience in tracking financial markets. With a keen interest in macroeconomics, Anil aptly tracks global news/updates and stays well-informed about the global financial moves and their implications.


