|

USD/TRY Price Analysis: Approaching key support, deeper losses eyed

  • USD/TRY falls 0.50% despite broad US dollar strength.
  • Turkish lira extends recovery from record lows of 8.8049.
  • The spot eyes 100-SMA on 4H chart, as technicals remain in favor of bears.

USD/TRY is seeing a six-day losing steak this Thursday, in a sustained correction from record highs of 8.8049 reached on June 2 after Turkey’s President Tayyip Erdogan spoke to the central bank governor about lowering interest rates in the next two months.

The spot ignores broadly firmer US dollar and Treasury yields, as the corrective decline remains at full swing. More downside remains in the offing, as depicted by USD/TRY’s four-hour technical chart.

The steady decline in the pair from all-time highs has carved out a falling wedge formation, with the price heading towards the lower boundary of the pattern.

At the time of writing, the spot is down about 0.50% on the day, testing multi-day lows just ahead of the 100-simple moving average (SMA) at 8.5249.

A breach of the latter could threaten the wedge support at 8.5138. The Relative Strength Index (RSI) continues to head closer towards the oversold territory, now at 32.10, leaving room for more downside.

The next relevant support area is seen at 8.47, the horizontal trendline in orange.

A bear cross, represented by the 21-SMA cutting through the 50-SMA from above, adds credence to a potential move lower.

USD/TRY: Four-hour chart

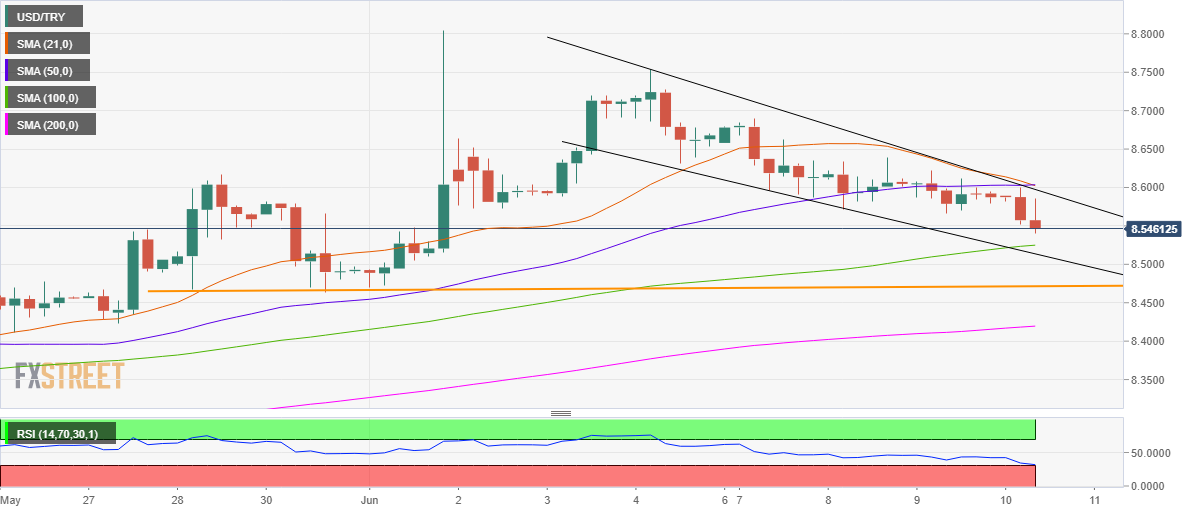
Alternatively, the confluence of the 21 and 50-SMAs at 8.6020 will act as a strong resistance, where the falling wedge hurdle also coincides.

Further up, buyers would look to test the June 7 high of 8.6902.

Author

Dhwani Mehta

Dhwani Mehta

FXStreet

Residing in Mumbai (India), Dhwani is a Senior Analyst and Manager of the Asian session at FXStreet. She has over 10 years of experience in analyzing and covering the global financial markets, with specialization in Forex and commodities markets.

More from Dhwani Mehta
Share:

Editor's Picks

AUD/USD stays bid above 0.7100 on Australian trade data, Mideast optimism

AUD/USD clings to minor recovery gains above 0.7100 in the Asian session on Thursday as a new Israel-Lebanon ceasefire keeps a lid on the safe-haven US Dollar. Meanwhile, strong AustralianTrade Balane data also help the Aussie pair sustain the bounce from weekly lows.

USD/JPY hovers near the 160.00 intervention threshold on Mideast tensions

USD/JPY struggles to find acceptance above 160.00 and retreats from a one-month high in the Asian session on Thursday amid fears that authorities will step in again to prop up the Japanese Yen. Furthermore, a new Israel-Lebanon ceasefire caps the US Dollar and supports the currency pair. However, renewed US-Iran tensions keep the downside limited in the Greenback and the pair.

Gold rebounds from one-week low as Israel-Lebanon truce pressures safe-haven USD

Gold gains some positive traction on Thursday and climbs to the $4,475 area during the Asian session, reversing a major part of the previous day's slide to a one-week low. The Israel-Lebanon truce prompts some profit-taking around the US Dollar and supports the commodity. 


Ethereum: Long-term holders' capitulation drives ETH below $1,800

Ethereum has fallen below $1,800 on Wednesday, the first time since May 2025 following accelerated spot selling pressure and distributions from long-term holders. The Age Consumed metric, which tracks the movement of previously idle tokens or long-term holders' coins, spiked over the past two days as prices declined, indicating increased selling activity among this cohort.

Kevin Warsh takes the Fed helm: What it means for the US Dollar
The Federal Reserve moves away from the highly predictable "forward guidance" model of the Jerome Powell era to a new “Kevin Warsh environment”, characterized by less communication, more policy surprises, and an increased focus on the Fed's complex balance sheet.
Recession on paper: What really moves the Canadian Loonie now?

Statistics Canada handed the headline writers a gift and the analysts a headache. Real GDP shrank 0.1% on an annualized basis in the first quarter, and with the fourth quarter of 2025 revised down to a 1.0% contraction, that is two negative quarters in a row, the textbook definition of a technical recession and Canada's first since the pandemic.