USD/TRY defends 50-DMA as bulls eye a sustained move above the psychological 12.00 mark
- USD/TRY price extends three-day winning streak on Wednesday.
- Turkish regulator files criminal complaints over lira’s moves.
- USD/TRY awaits acceptance above 12.00 after recapturing 50-DMA.

USD/TRY is holding onto Tuesday’s advance while trading just below the 12.00 level, as bulls contemplate the next move amid thin end-of-year liquidity conditions.
The market mood remains mixed amid surging covid cases globally, underpinning the US dollar’s haven demand. Additionally, rising inflation expectations also collaborate with the dollar’s upside, keeping the sentiment buoyed around the spot.
On the TRY-side of the equation, the lira received headwinds from a report carried by the Financial Times (FT), citing that “Turkey’s banking regulator has filed a criminal complaint against more than 20 people, including former central bank governors, journalists and an economist, over alleged attempts to manipulate the country’s exchange rate in a move that could chill criticism of the government’s unorthodox economic policies.”
Meanwhile, the latest Reuters poll revealed that “Turkey's annual inflation rate is expected to have hit 30.6% in December, breaching the 30% level for the first time since 2003 as prices rose due to record lira volatility,”
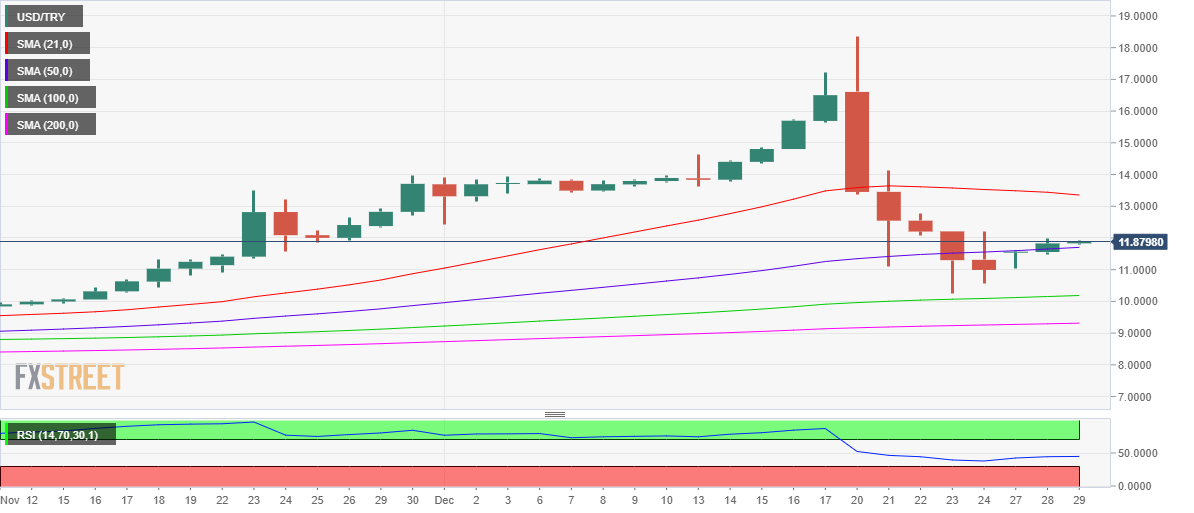
Looking at USD/TRY’s technical chart, the spot yielded a daily closing above the 50-Daily Moving Average (DMA) resistance, now at 11.70, having bounced off the critical 100-DMA support in the previous week.
The 14-day Relative Strength Index (RSI) is inching closer towards the midline, still below the midline, threatening the recovery momentum in the spot.
Failure to resist above the 50-DMA could recall sellers for a test of Monday’s low of 11.07, below which the 100-DMA at 10.18 will be back in play.
On the upside, the next relevant resistance is seen at Christmas Eve’s high of 12.19 once the 12.00 mark is taken out convincingly.
Further up, a rally towards the 21-DMA at 13.35 cannot be ruled out.
USD/TRY: Daily chart
Author

Dhwani Mehta
FXStreet
Residing in Mumbai (India), Dhwani is a Senior Analyst and Manager of the Asian session at FXStreet. She has over 10 years of experience in analyzing and covering the global financial markets, with specialization in Forex and commodities markets.


