|

USD/MXN rises above 18.1000 despite a soft USD

  • The US JOLTs report showed a decrease of 632,000 job vacancies in February.
  • Factory Orders in the US fell in February, caused by higher borrowing costs.
  • Money market futures estimate a 57% chance of a pause in the Fed’s tightening cycle.

Despite the greenback’s weakness, the Mexican Peso (MXN) losses ground vs. the US Dollar (USD). Deterioration in market sentiment and worse-than-expected economic data from the United States (US) spurred capital outflows from emerging market economies. At the time of writing, the USD/MXN is trading at 18.1170, above its opening price by 0.34%.

USD/MXN climbs on risk-off mood

US equities remain to trade in negative territory, while US Treasury bond yields plunge. Data released by the US Department of Labor showed that job vacancies dropped by 632,000 to 9.9 million, as shown by February’s JOLTs report. At the same time, Factory Orders fell in February, dropping 0.7% MoM, slightly recovering from January’s 2.1% plunge.

Following the latest reports, investors increased their bets that the US Federal Reserve (Fed) will pause its tightening cycle. Money market futures estimate a 57% chance of a pause, compared to Monday’s 43% odds. The forecast for 25 bps lies at a 43% chance.

The US Dollar Index (DXY), a gauge that measures the performance of six currencies vs. the American Dollar (USD), drops 0.44% and sits at 101.591, sponsored by falling US Treasury bond yields. The US bond yields plunge was spurred by traders repricing a less aggressive Federal Reserve.

An absent Mexican economic docket left USD/MXN traders adrift to sentiment and US Dollar dynamics. Bad news for the US economy is beginning to weigh on the greenback, with investors shifting towards growth as inflation cools.

USD/MXN Technical analysis

USD/MXN Daily chart

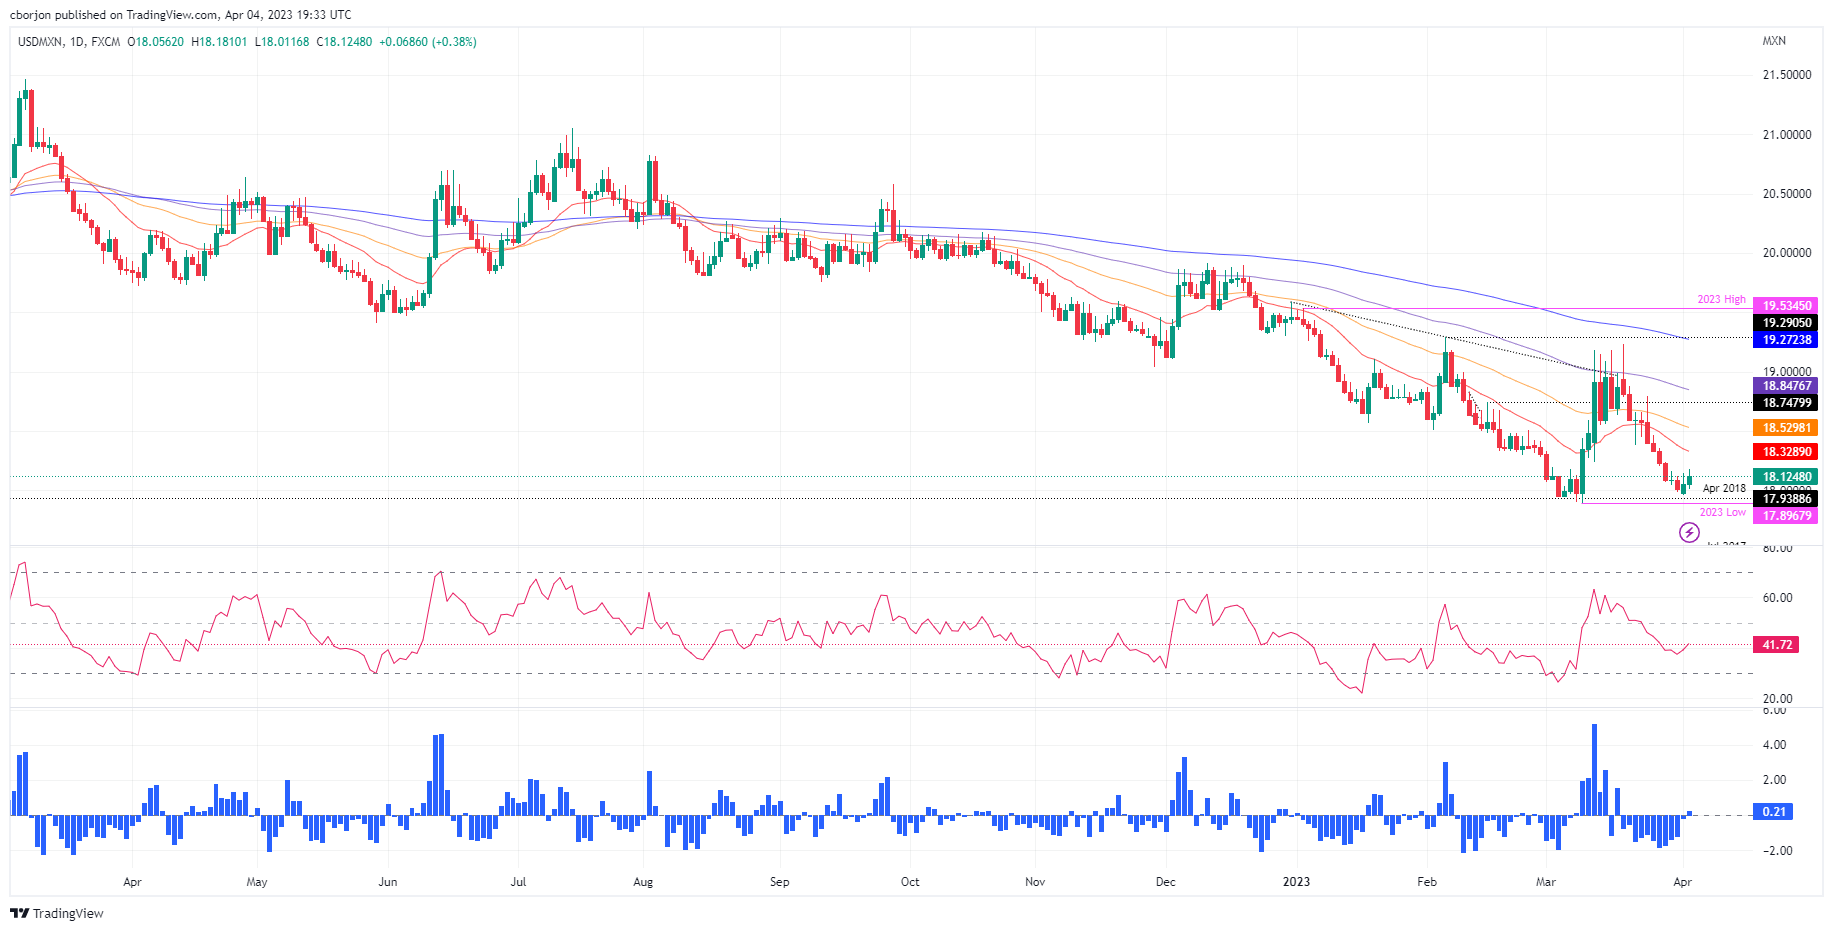
The USD/MXN appears to have bottomed at around the weekly low of 17.9644, reached on Monday. A double bottom emerged though the USD/MXN needs to reclaim the 20, 50, and 100-day EMAs in the near term, so the chart pattern could remain in play. Therefore, if the USD/MXN cracks the 100-day EMA at 18.8477, that could open the door for further upside. That said, the USD/MXN next resistance would be the 19.0000 figure, followed by the March 20 high at 19.2327 and the February 6 high at 19.2905, before aiming towards the YTD high at 19.5345.

USD/MXN

Overview
Today last price18.1264
Today Daily Change0.0633
Today Daily Change %0.35
Today daily open18.0631
 
Trends
Daily SMA2018.4466
Daily SMA5018.5156
Daily SMA10018.9378
Daily SMA20019.5226
 
Levels
Previous Daily High18.1487
Previous Daily Low17.966
Previous Weekly High18.4681
Previous Weekly Low17.99
Previous Monthly High19.2324
Previous Monthly Low17.8977
Daily Fibonacci 38.2%18.0789
Daily Fibonacci 61.8%18.0358
Daily Pivot Point S117.9698
Daily Pivot Point S217.8766
Daily Pivot Point S317.7872
Daily Pivot Point R118.1525
Daily Pivot Point R218.2419
Daily Pivot Point R318.3352
 

Author

Christian Borjon Valencia

Markets analyst, news editor, and trading instructor with over 14 years of experience across FX, commodities, US equity indices, and global macro markets.

More from Christian Borjon Valencia
Share:

Editor's Picks

EUR/USD holds above 1.1750 after mixed EU PMI data

EUR/USD manages to hold above 1.1750 but struggles to gather recovery momentum on Friday, following the mixed February PMI figures from Germany and the Eurozone. In the second half of the day, Q4 GDP, December inflation and February PMI data from the US will be watched closely by market participants.

GBP/USD recovers further toward 1.3500 after UK PMI data

GBP/USD is recovering ground further toward 1.3500 in European trading on Friday, helped by a modest uptick in the Pound Sterling after stronger-than-expected UK January Retail Sales and February PMI data. However, the pair's further upside could be limited amid persistent US Dollar strength as the focus turns to key US data. 

Gold sticks to positive bias above $5,000 ahead of US data

Gold gains some positive traction for the third consecutive day on Friday. holding above $5,000. Traders now look forward to the key US macro releases – the Advance Q4 GDP report and the Personal Consumption Expenditures (PCE) Price Index – for fresh trading impetus. 

US GDP growth expected to slow down significantly in Q4 after stellar Q3 

The United States Bureau of Economic Analysis will publish the first preliminary estimate of the fourth-quarter Gross Domestic Product at 13:30 GMT. Analysts forecast the US economy to have expanded at a 3% annualized rate, slowing down from the 4.4% growth posted in the previous quarter.

Iran tensions and AI fears at the forefront ahead of key US data

Thursday’s scorecard shows major US Stock benchmarks closed modestly in the red amid mounting US-Iran tensions and AI disruption worries. The S&P 500 shed 19 points (0.3%) to 6,861, the Nasdaq 100 lost 101 points (0.4%) to 24,797, and the Dow Jones Industrial Average dropped 267 points (0.5%) to 49,395.

Official Trump price approaches breakout with mixed signals from traders

Official Trump (TRUMP) is trading at $3.50 at the time of writing, approaching its upper consolidation range. A breakout from this range could open the door for an upside move. On-chain data shows market indecision, with balanced flows between bulls and bears, signaling a lack of clear directional bias.