|

USD/MXN Technical Analysis: Outlook for Mexican peso improves after recovery from 5-month lows

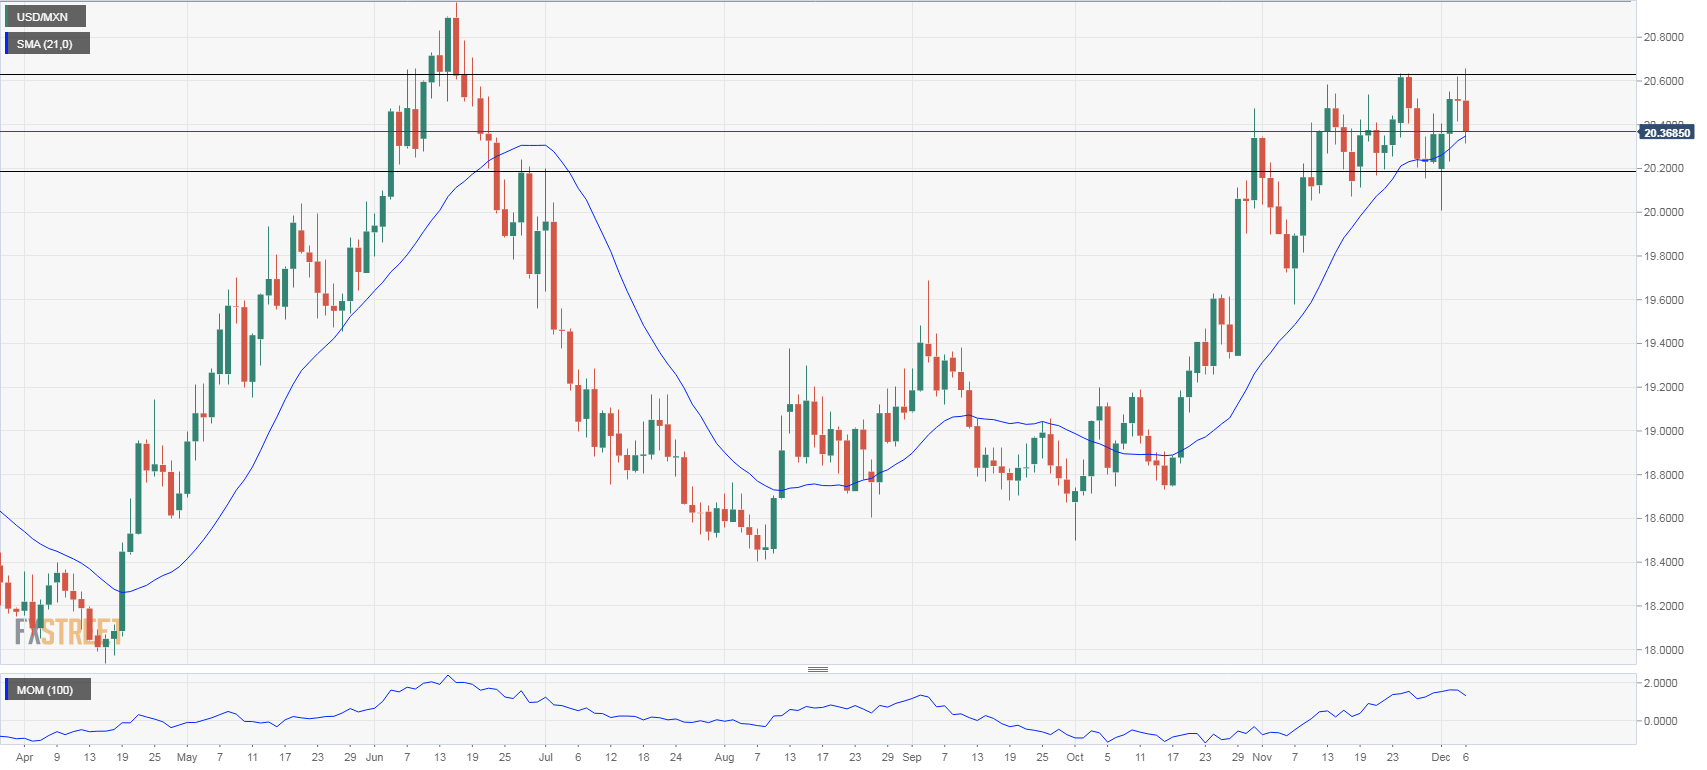
  • The USD/MXN hit earlier today at 20.65, the highest level since June but then pulled back making a reversal. The momentum indicator turned to the downside and price dropped to test the 20-day moving average, showing lack of strength so far for a move above 20.65. 
  • A daily close above 20.50 could reinforce the bullish trend, but a breakout on top of 20.65 is needed to open the doors to further gains. 
  • After today’s reversal and the failure at 20.60, the Mexican peso could recover further, particularity if the pair drops firmly under 20.35 (20-day moving average). The next support to watch is 20.20; below the 20.00 area would be exposed. 
  • The main trend still points to the upside in USD/MXN, but the US dollar positive tone in the short-term eased after today’s reversal, and now the bias is skewed toward an extension of the bearish correction. 

USD/MXN Daily Chart

USD/MXN

USD/MXN

Overview:
    Today Last Price: 20.3748
    Today Daily change %: -0.657%
    Today Daily Open: 20.5096
Trends:
    Previous Daily SMA20: 20.349
    Previous Daily SMA50: 19.724
    Previous Daily SMA100: 19.3117
    Previous Daily SMA200: 19.2546
Levels:
    Previous Daily High: 20.6183
    Previous Daily Low: 20.417
    Previous Weekly High: 20.6355
    Previous Weekly Low: 20.156
    Previous Monthly High: 20.6355
    Previous Monthly Low: 19.576
    Previous Daily Fibonacci 38.2%: 20.4939
    Previous Daily Fibonacci 61.8%: 20.5414
    Previous Daily Pivot Point S1: 20.4117
    Previous Daily Pivot Point S2: 20.3137
    Previous Daily Pivot Point S3: 20.2103
    Previous Daily Pivot Point R1: 20.613
    Previous Daily Pivot Point R2: 20.7163
    Previous Daily Pivot Point R3: 20.8143

Author

Matías Salord

Matías started in financial markets in 2008, after graduating in Economics. He was trained in chart analysis and then became an educator. He also studied Journalism. He started writing analyses for specialized websites before joining FXStreet.

More from Matías Salord
Share:

Editor's Picks

EUR/USD looks apathetic around 1.1770

EUR/USD comes under renewed pressure on Tuesday, deflating below the 1.1800 support and reversing two consecutive days of gains. The pair’s decline follows the persistent move higher in the US Dollar, as trade uncertainty dominates the sentiment ahead of President Trump’s SOTU speech.

GBP/USD regains 1.3500 and above

GBP/USD extends its advance for the third day in a row on Tuesday, this time retesting the area beyond the 1.3500 hurdle. Cable’s uptick comes despite decent gains in the Greenback and the dovish message from the BoE’s Bailey at the UK Parliament.

Gold appears offered around $5,150

Gold is giving back a good portion of the recent multi-day rally, receding to the $5,150 zone per troy ounce amid the decent bounce in the US Dollar and mixed US Treasuty yields. In the meantime, markets’ attention remain on upcoming comments from Fed speakers.

Crypto Today: Bitcoin, Ethereum, XRP come under renewed pressure amid ETF outflows, tariff uncertainty

Bitcoin, Ethereum and Ripple are trading under increasing selling pressure at the time of writing on Tuesday, as market participants navigate renewed tariff uncertainty. The Crypto King holds above $63,000, down 2% intraday from its $64,656 open.

The Citrini report: How a debatable AI narrative can shake Wall Street

That AI-related headline alone was enough to rattle investors.US stocks slid sharply on Monday after a widely circulated Citrini Research memo outlined a hypothetical “2028 Global Intelligence Crisis”, warning that rapid AI adoption could push US unemployment into double digits as early as by mid-2028.

XRP pressured by weak ETF flows and declining retail interest

Ripple (XRP) is edging lower, trading above its intraday low of $1.32 at the time of writing on Tuesday. The decline from its weekly opening of $1.39 reflects heightened volatility in the broader cryptocurrency market, accentuated by tariff-triggered uncertainty.