|

USD/MXN Price Analysis: Trades with mild negative bias, dip-buying should help limit deeper losses

  • USD/MXN remains depressed for the third successive day on Monday.
  • The mixed technical setup warrants some caution for bearish traders.
  • Any further decline towards the 17.2500 support could get bought into.

The USD/MXN pair attracts some sellers near the 17.4420 area during the Asian session and trades with a mild negative bias for the third successive day on Monday. Spot prices, however, manage to hold above a multi-day touched on Friday and currently hover around the 17.4000 level, down just over 0.10% for the day.

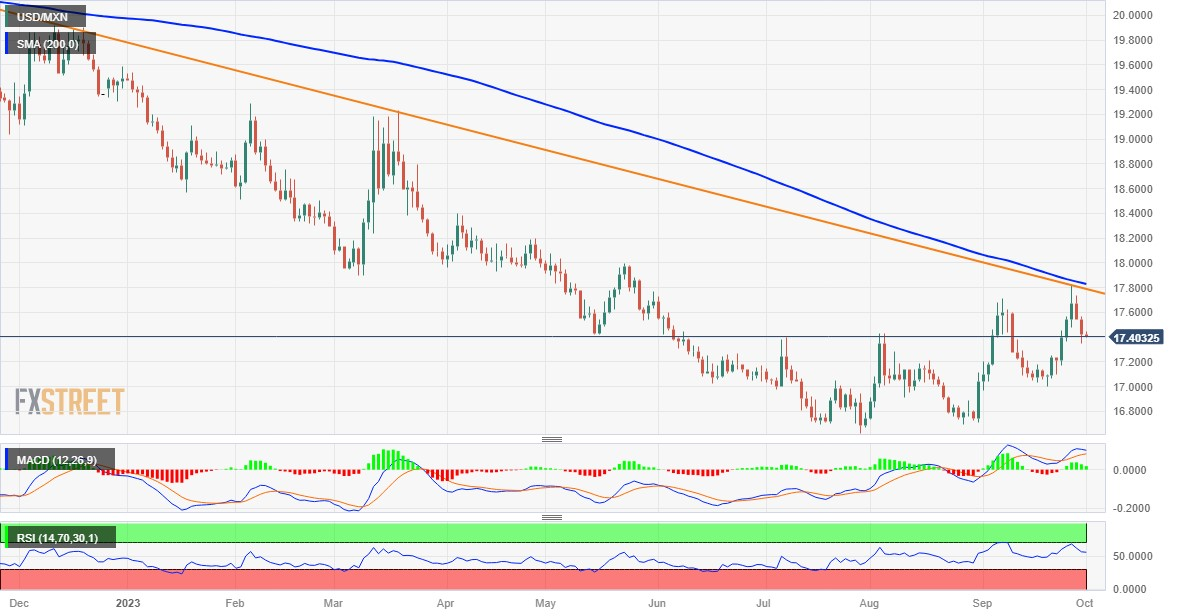
From a technical perspective, last week's failure near the 17.8175 confluence – comprising a declining trendline extending from the July swing high and the very important 200-day Simple Moving Average (SMA) – and the subsequent slide favours bearish traders. That said, oscillators on the daily chart are holding in the positive territory and warrant some caution before positioning for any further losses for the USD/MXN pair.

Hence, any further decline is more likely to find decent support near the 17.2510-17.2500 horizontal zone. The mentioned area should act as a pivotal point, which if broken decisively will reaffirm the negative outlook and drag the USD/MXN pair to the next relevant support near the 17.0400 area en route to sub-17.0000 levels (September 20 low). The downward trajectory could get extended further towards the 16.7550 support.

On the flip side, the 17.5415-17.5420 region now seems to act as an immediate hurdle ahead of the 17.6695-17.7000 area. Some follow-through buying should allow the USD/MXN to challenge the aforementioned confluence, around the 17.8100-17.8175 zone. A convincing breakout through will be seen as a fresh trigger for bullish traders and pave the way for an extension of the recent recovery from a multi-year low touched in August.

USD/MXN daily chart

fxsoriginal

Technical levels to watch

USD/MXN

Overview
Today last price17.4064
Today Daily Change-0.0136
Today Daily Change %-0.08
Today daily open17.42
 
Trends
Daily SMA2017.3263
Daily SMA5017.1082
Daily SMA10017.1884
Daily SMA20017.8391
 
Levels
Previous Daily High17.5632
Previous Daily Low17.3493
Previous Weekly High17.8174
Previous Weekly Low17.1723
Previous Monthly High17.8174
Previous Monthly Low16.9727
Daily Fibonacci 38.2%17.431
Daily Fibonacci 61.8%17.4815
Daily Pivot Point S117.3251
Daily Pivot Point S217.2303
Daily Pivot Point S317.1112
Daily Pivot Point R117.539
Daily Pivot Point R217.658
Daily Pivot Point R317.7529

Author

Haresh Menghani

Haresh Menghani is a detail-oriented professional with 10+ years of extensive experience in analysing the global financial markets.

More from Haresh Menghani
Share:

Editor's Picks

AUD/USD consolidates above 0.7000/two-month low; bearish potential intact

The AUD/USD pair oscillates in a narrow range during the Asian session, and moves little following the release of mixed inflation figures from China. Spot prices currently trade around the 0.7025 region, nearly unchanged for the day, and remain within striking distance of a nearly two-month low set on Tuesday. Renewed hostilities between the US and Iran temper hopes for a deal to end the over three-month-old war.

Japanese Yen languishes despite wholesale inflation accelerates in May

USD/JPY flatlines after experiencing volatility, trading around 160.40 during the Asian hours on Wednesday. The pair continues to hold its ground, reflecting a struggling Japanese Yen that has failed to find support despite a massive acceleration in wholesale inflation. Driven by surging energy costs linked to the ongoing Middle East conflict, Japan’s Producer Price Index jumped 6.3% year-over-year in May. This hot printing comfortably outpaced April’s upwardly revised 5.3% figure and surpassed market consensus of 5.5%, marking the fastest pace of wholesale price growth in three years.

$4,200: Gold retains bearish bias near March low ahead of US CPI

Gold recovers slightly after touching a fresh low since March 23, though it retains a bearish bias near the $4,200 mark through the early European session. Renewed hostilities between the US and Iran fuel inflationary concerns and bolster bets for more hawkish central banks, which is seen as a key factor driving flows away from the non-yielding yellow metal. Furthermore, the decline could be attributed to technical selling following the recent breakdown below the very important 200-day SMA.

Cardano's downtrend deepens despite on-chain bottoming signals

Cardano edges lower to $0.1600 signaling a potential extension of the 30% loss from last week. The altcoin remains under intense selling pressure, weighing on its retail support. Still, a spike in dormant supply re-entering circulation signals that the selling pressure has run its course, a pattern that often precedes a rebound.

US CPI data set to show inflation at three-year high in May, backing Fed hawkish tilt

The US Bureau of Labor Statistics will publish the May Consumer Price Index (CPI) data on Wednesday. The report is expected to show another step up in consumer inflation, driven by the persistently high Oil prices due to the ongoing crisis in the Middle East.

The US economy defies the rules: 100 days into the Oil shock and the recession signal is still missing

More than three months after the start of the Iran war and the resulting disruption to global energy markets, the US economy continues to display remarkable resilience. The conflict has triggered a sharp rise in Oil prices, reignited inflationary pressures and fueled widespread concerns about a potential economic slowdown.