|

USD/MXN Price Analysis: Sticks to modest intraday gains, not out of the woods yet

  • USD/MXN regain positive traction on Thursday, albeit lacks any follow-through.
  • The overnight failure near the descending channel hurdle favours bearish traders.
  • A move beyond the 200-period on H4 is needed to negate the negative outlook.

The USD/MXN pair attracts some buying on Thursday and reverses a part of the previous day's retracement slide from over a one-week high, around the 17.2575 area. Spot prices trade with a mild positive bias just below the 17.15 level through the early part of the European session, albeit seems to lack follow-through.

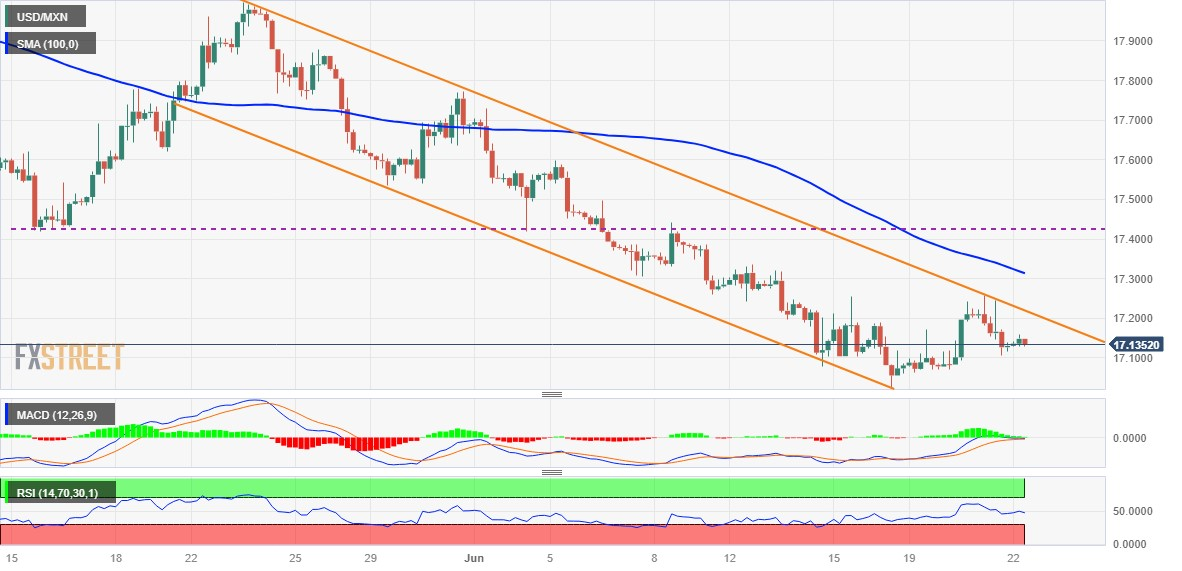
From a technical perspective, the overnight failure near a hurdle marked by the top end of a descending channel, extending from the 18.00, or the May swing high, warrants caution for bullish traders. Moreover, oscillators on the daily chart are holding deep in the bearish territory and have also recovered from the overbought zone. This makes it prudent to wait for a convincing break through the descending channel resistance, currently around the 17.2320-17.2325 area, before confirming that the USD/MXN pair has formed a near-term bottom.

The subsequent move-up has the potential to lift spot prices to the 100-period Simple Moving Average (SMA) hurdle near the 17.3200 area. Some follow-through buying will set the stage for a meaningful near-term recovery towards the 17.4265-17.4270 area en route to the 17.5020-17.5025 region and the next relevant resistance around the 17.6000 level.

On the flip side, the 17.0560-17.0555 region now seems to protect the immediate downside ahead of the multi-year low, around the 17.0245-17.0240 area. This is followed by the 17.00 psychological mark and the descending trend-channel support, which if broken decisively will be seen as a fresh trigger for bearish traders. The USD/MXN pair might then turn vulnerable to accelerate the fall towards the 16.60-16.55 zone before dropping to the November 2015 swing low, around the 16.35 region.

USD./MXN 4-hour chart

fxsoriginal

Key levels to watch

USD/MXN

Overview
Today last price17.139
Today Daily Change0.0200
Today Daily Change %0.12
Today daily open17.119
 
Trends
Daily SMA2017.3815
Daily SMA5017.6709
Daily SMA10018.0521
Daily SMA20018.8047
 
Levels
Previous Daily High17.2576
Previous Daily Low17.106
Previous Weekly High17.3353
Previous Weekly Low17.0243
Previous Monthly High18.078
Previous Monthly Low17.4203
Daily Fibonacci 38.2%17.1639
Daily Fibonacci 61.8%17.1997
Daily Pivot Point S117.0642
Daily Pivot Point S217.0094
Daily Pivot Point S316.9127
Daily Pivot Point R117.2157
Daily Pivot Point R217.3124
Daily Pivot Point R317.3673

Author

Haresh Menghani

Haresh Menghani is a detail-oriented professional with 10+ years of extensive experience in analysing the global financial markets.

More from Haresh Menghani
Share:

Markets move fast. We move first.

Orange Juice Newsletter brings you expert driven insights - not headlines. Every day on your inbox.

By subscribing you agree to our Terms and conditions.

Editor's Picks

EUR/USD moves sideways below 1.1800 on Christmas Eve

EUR/USD struggles to find direction and trades in a narrow channel below 1.1800 after posting gains for two consecutive days. Bond and stock markets in the US will open at the usual time and close early on Christmas Eve, allowing the trading action to remain subdued. 

GBP/USD keeps range around 1.3500 amid quiet markets

GBP/USD keeps its range trade intact at around 1.3500 on Wednesday. The Pound Sterling holds the upper hand over the US Dollar amid pre-Christmas light trading as traders move to the sidelines heading into the holiday season. 

Gold retreats from record highs, trades below $4,500

Gold retreats after setting a new record-high above $4,520 earlier in the day and trades in a tight range below $4,500 as trading volumes thin out ahead of the Christmas break. The US Dollar selling bias remains unabated on the back of dovish Fed expectations, which continues to act as a tailwind for the bullion amid persistent geopolitical risks.

Bitcoin slips below $87,000 as ETF outflows intensify, whale participation declines

Bitcoin price continues to trade around $86,770 on Wednesday, after failing to break above the $90,000 resistance. US-listed spot ETFs record an outflow of $188.64 million on Tuesday, marking the fourth consecutive day of withdrawals.

Economic outlook 2026-2027 in advanced countries: Solidity test

After a year marked by global economic resilience and ending on a note of optimism, 2026 looks promising and could be a year of solid economic performance. In our baseline scenario, we expect most of the supportive factors at work in 2025 to continue to play a role in 2026.

Avalanche struggles near $12 as Grayscale files updated form for ETF

Avalanche trades close to $12 by press time on Wednesday, extending the nearly 2% drop from the previous day. Grayscale filed an updated form to convert its Avalanche-focused Trust into an ETF with the US Securities and Exchange Commission.