|

USD/MXN Price Analysis: Retreats to near 17.16 before immediate support at seven-day EMA

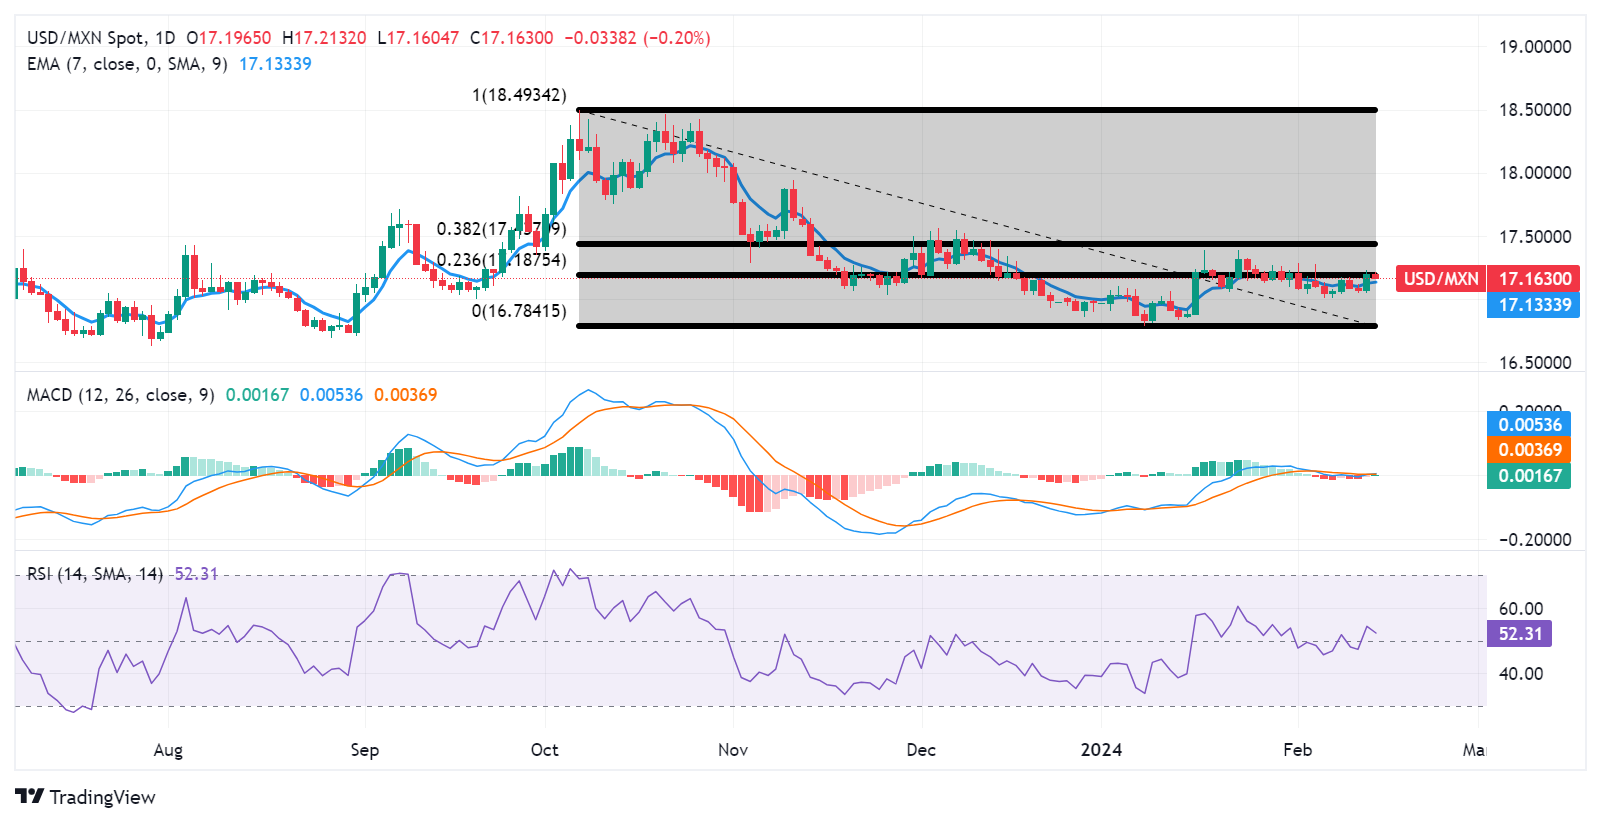
  • USD/MXN could find immediate support at the seven-day EMA at 17.13 followed by the weekly low at 17.04.
  • Technical analysis suggests a confirmation of the bullish sentiment towards an upward trend.
  • The key resistance appears around the 23.6% Fibonacci retracement at 17.18 followed by the major support at 17.50 level.

USD/MXN snaps the recent gains and edges lower to near 17.16 during the European hours on Wednesday. The immediate support appears at the seven-day Exponential Moving Average (EMA) at the 17.13 level.

A break below the latter could put pressure on the USD/MXN pair to navigate the major support region around the weekly low at 17.04 aligned with the major level and February’s low at 17.00 level.

The 14-day Relative Strength Index (RSI), a momentum oscillator that measures the speed and change of price movements is positioned above the 50 mark, indicating the bullish momentum for the USD/MXN pair.

Additionally, Additionally, the lagging indicator “Moving Average Convergence Divergence (MACD)” lies above the centerline and the signal line, which suggests a confirmation of a bullish sentiment towards an upward trend.

On the upside, the USD/MXN pair could find the immediate resistance at the 23.6% Fibonacci retracement at 17.18 followed by the 38.2% Fibonacci retracement at 17.43, in conjunction with the major support at the 17.50 level. A breakthrough above the major barrier could lead the USD/MXN pair to explore the area around the 17.60 level.

USD/MXN: Daily Chart

USD/MXN: additional technical levels

Overview
Today last price17.1638
Today Daily Change-0.0330
Today Daily Change %-0.19
Today daily open17.1968
 
Trends
Daily SMA2017.1561
Daily SMA5017.1085
Daily SMA10017.4048
Daily SMA20017.297
 
Levels
Previous Daily High17.2288
Previous Daily Low17.0509
Previous Weekly High17.2807
Previous Weekly Low17.0078
Previous Monthly High17.3871
Previous Monthly Low16.7842
Daily Fibonacci 38.2%17.1609
Daily Fibonacci 61.8%17.1189
Daily Pivot Point S117.0889
Daily Pivot Point S216.981
Daily Pivot Point S316.911
Daily Pivot Point R117.2668
Daily Pivot Point R217.3368
Daily Pivot Point R317.4447

Author

Akhtar Faruqui

Akhtar Faruqui is a Forex Analyst based in New Delhi, India. With a keen eye for market trends and a passion for dissecting complex financial dynamics, he is dedicated to delivering accurate and insightful Forex news and analysis.

More from Akhtar Faruqui
Share:

Markets move fast. We move first.

Orange Juice Newsletter brings you expert driven insights - not headlines. Every day on your inbox.

By subscribing you agree to our Terms and conditions.

Editor's Picks

EUR/USD clings to small gains near 1.1750

Following a short-lasting correction in the early European session, EUR/USD regains its traction and clings to moderate gains at around 1.1750 on Monday. Nevertheless, the pair's volatility remains low, with investors awaiting this weeks key data releases from the US and the ECB policy announcements.

GBP/USD edges higher toward 1.3400 ahead of US data and BoE

GBP/USD reverses its direction and advances toward 1.3400 following a drop to the 1.3350 area earlier in the day. The US Dollar struggles to gather recovery momentum as markets await Tuesday's Nonfarm Payrolls data, while the Pound Sterling holds steady ahead of the BoE policy announcements later in the week.

Gold stuck around $4,300 as markets turn cautious

Gold loses its bullish momentum and retreats below $4,350 after testing this level earlier on Monday. XAU/USD, however, stays in positive territory as the US Dollar remains on the back foot on growing expectations for a dovish Fed policy outlook next year.

Solana consolidates as spot ETF inflows near $1 billion signal institutional dip-buying

Solana price hovers above $131 at the time of writing on Monday, nearing the upper boundary of a falling wedge pattern, awaiting a decisive breakout. On the institutional side, demand for spot Solana Exchange-Traded Funds remained firm, pushing total assets under management to nearly $1 billion since launch. 

Big week ends with big doubts

The S&P 500 continued to push higher yesterday as the US 2-year yield wavered around the 3.50% mark following a Federal Reserve (Fed) rate cut earlier this week that was ultimately perceived as not that hawkish after all. The cut is especially boosting the non-tech pockets of the market.

Solana Price Forecast: SOL consolidates as spot ETF inflows near $1 billion signal institutional dip-buying

Solana (SOL) price hovers above $131 at the time of writing on Monday, nearing the upper boundary of a falling wedge pattern, awaiting a decisive breakout.