|

USD/MXN Price Analysis: Multiple Doji candlesticks challenge Mexican Peso traders near 18.00

  • USD/MXN struggles for clear directions as it flirts with short-term key support.
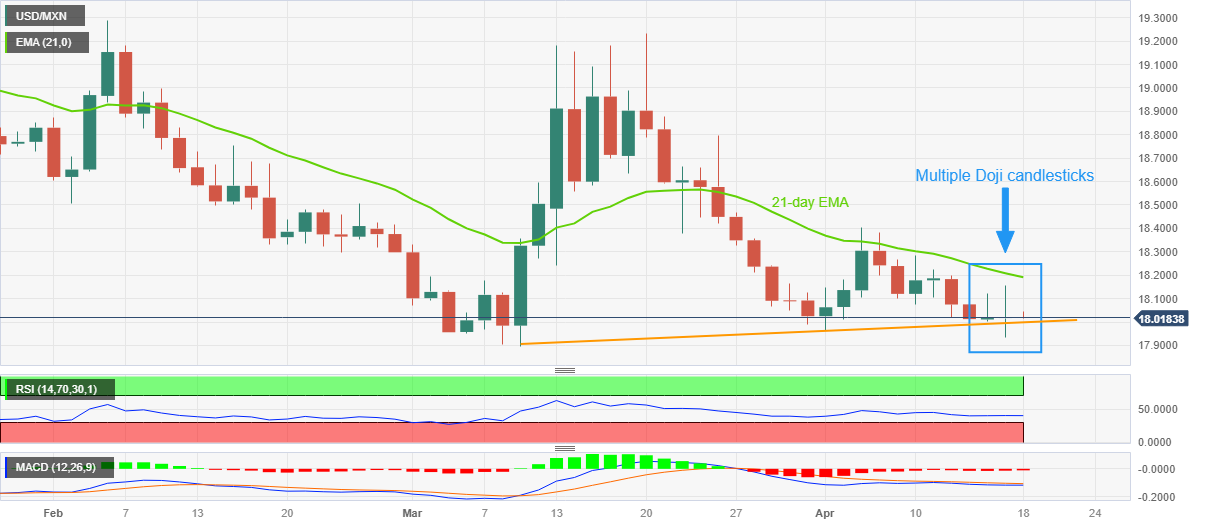
  • Multiple Doji candlesticks, sluggish oscillators suggest Mexican Peso buyers run out of steam.
  • USD/MXN needs validation from 21-day EMA to convince short-term

USD/MXN appears indecisive around 18.00 amid early Tuesday in Europe, keeping the three-day trend of inaction.

That said, the Mexican Peso (MXN) pair has been lackluster and portrays Doji candlesticks since the last Friday. While doing the same, the quote also seesaws around a five-week-old ascending support line, close to 17.99 by the press time.

Apart from the Doji candlesticks that show traders’ indecision and challenge the USD/MXN pair’s downward trajectory from late March, the sluggish RSI (14) and MACD signals also tease the Mexican Peso sellers.

However, a daily closing beyond the 21-day Exponential Moving Average (EMA), close to 18.20 at the latest, becomes necessary for the USD/MXN buyers to convince intraday traders.

Following that, the monthly high of 18.40 and the 19.00 round figure will gain the market’s attention.

Should the USD/MXN bulls keep the reins past 19.00, tops marked during March and February, around 19.23 and 19.30 respectively, will be in the spotlight.

Alternatively, a daily closing below the aforementioned support line, close to 17.99, will be enough to challenge the multi-month low marked earlier in March, near 17.89.

If at all the USD/MXN remains bearish past 17.89, multiple lows marked in June 2017 around 17.80 and the year 2017 bottom surrounding 17.44 could please the bears afterward.

USD/MXN: Daily chart

Trend: Recovery expected

Additional important levels

Overview
Today last price18.023
Today Daily Change0.0014
Today Daily Change %0.01%
Today daily open18.0216
 
Trends
Daily SMA2018.219
Daily SMA5018.3788
Daily SMA10018.8118
Daily SMA20019.41
 
Levels
Previous Daily High18.1542
Previous Daily Low17.9329
Previous Weekly High18.2844
Previous Weekly Low17.9753
Previous Monthly High19.2324
Previous Monthly Low17.8977
Daily Fibonacci 38.2%18.0696
Daily Fibonacci 61.8%18.0174
Daily Pivot Point S117.9183
Daily Pivot Point S217.8149
Daily Pivot Point S317.697
Daily Pivot Point R118.1395
Daily Pivot Point R218.2575
Daily Pivot Point R318.3608

Author

Anil Panchal

Anil Panchal

FXStreet

Anil Panchal has nearly 15 years of experience in tracking financial markets. With a keen interest in macroeconomics, Anil aptly tracks global news/updates and stays well-informed about the global financial moves and their implications.

More from Anil Panchal
Share:

Markets move fast. We move first.

Orange Juice Newsletter brings you expert driven insights - not headlines. Every day on your inbox.

By subscribing you agree to our Terms and conditions.

Editor's Picks

EUR/USD bounces toward 1.1750 as US Dollar loses strength

EUR/USD returned to the 1.1750 price zone in the American session on Friday, despite falling Wall Street, which indicates risk aversion. Trading conditions remain thin following the New Year holiday and ahead of the weekend, with the focus shifting to US employment and European data scheduled for next week.

GBP/USD nears 1.3500, holds within familiar levels

After testing 1.3400 on the last day of 2025, GBP/USD managed to stage a rebound. Nevertheless, the pair finds it difficult to gather momentum and trades with modest intraday gains at around 1.3490 as market participants remain in holiday mood.

Gold trims intraday gains, approaches $4,300

Gold retreated sharply from the $4,400  area and trades flat for the day in the $4,320 price zone. Choppy trading conditions exacerbated the intraday decline, although XAU/USD bearish case is out of the picture, considering growing expectations for a dovish Fed and persistent geopolitical tensions.

Cardano gains early New Year momentum, bulls target falling wedge breakout

Cardano kicks off the New Year on a positive note and is extending gains, trading above $0.36 at the time of writing on Friday. Improving on-chain and derivatives data point to growing bullish interest, while the technical outlook keeps an upside breakout in focus.

Economic outlook 2026-2027 in advanced countries: Solidity test

After a year marked by global economic resilience and ending on a note of optimism, 2026 looks promising and could be a year of solid economic performance. In our baseline scenario, we expect most of the supportive factors at work in 2025 to continue to play a role in 2026.

Crypto market outlook for 2026

Year 2025 was volatile, as crypto often is.  Among positive catalysts were favourable regulatory changes in the U.S., rise of Digital Asset Treasuries (DAT), adoption of AI and tokenization of Real-World-Assets (RWA).