|

USD/MXN Price Analysis: Mexican Peso grinds near 18.00 within symmetrical triangle

  • USD/MXN picks up bids to refresh intraday high, consolidates the biggest daily loss in a month.
  • Bearish MACD signals challenge Mexican Peso sellers, 200-EMA acts as additional upside hurdle for the pair.
  • Multiple levels towards the south challenge USD/MXN bears inside three-week-old triangle.

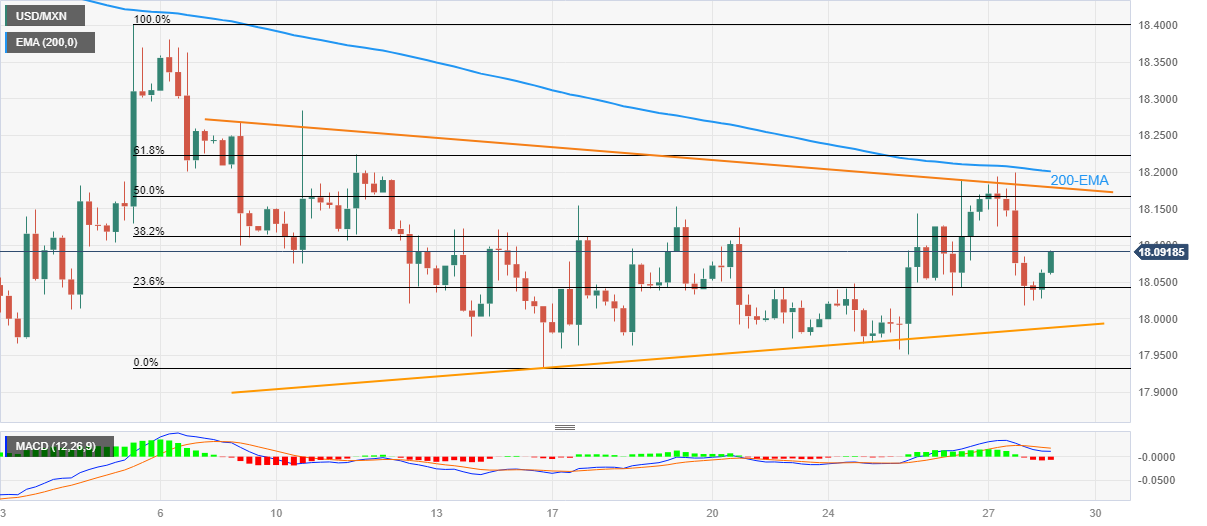
USD/MXN renews its intraday high near 18.09 as it pares the biggest daily loss in one month during early Friday. In doing so, the Mexican Peso (MXN) pair remains inside a three-week-old symmetrical triangle, reversing the pullback from the top of late.

It’s worth noting that the pair’s repeated failures to cross the 200-bar Exponential Moving Average (EMA) join bearish MACD signals to keep the USD/MXN bears hopeful despite the pair’s latest rebound.

That said, the 38.2% and 50% Fibonacci retracement levels of the USD/MXN’s April 05-16 fall, respectively near 18.11 and 18.16, act as nearby resistance for the buyers to watch before challenging the stated triangle’s top line, close to 18.18.

Following that, the 200-EMA level of 18.20 can act as the last defense of the bears before signaling a run-up toward the monthly high of near 18.40.

Alternatively, a 23.6% Fibonacci retracement puts the short-term price limit under the pair near 18.04, a break of which will highlight the aforementioned triangle’s lower line, currently around the 18.00 round figure.

In a case where the USD/MXN bears keep the reins, the monthly low near 17.93 and the previous monthly bottom surrounding 17.89 can prod the downside moves before signaling a fall towards the year 2017 trough of around 17.44.

USD/MXN: Four-hour chart

Trend: Limited recovery expected

Additional important levels

Overview
Today last price18.0834
Today Daily Change0.0445
Today Daily Change %0.25%
Today daily open18.0389
 
Trends
Daily SMA2018.086
Daily SMA5018.2758
Daily SMA10018.6967
Daily SMA20019.3062
 
Levels
Previous Daily High18.2
Previous Daily Low18.0182
Previous Weekly High18.1542
Previous Weekly Low17.9329
Previous Monthly High19.2324
Previous Monthly Low17.8977
Daily Fibonacci 38.2%18.0877
Daily Fibonacci 61.8%18.1306
Daily Pivot Point S117.9714
Daily Pivot Point S217.9039
Daily Pivot Point S317.7895
Daily Pivot Point R118.1532
Daily Pivot Point R218.2676
Daily Pivot Point R318.3351

Author

Anil Panchal

Anil Panchal

FXStreet

Anil Panchal has nearly 15 years of experience in tracking financial markets. With a keen interest in macroeconomics, Anil aptly tracks global news/updates and stays well-informed about the global financial moves and their implications.

More from Anil Panchal
Share:

Markets move fast. We move first.

Orange Juice Newsletter brings you expert driven insights - not headlines. Every day on your inbox.

By subscribing you agree to our Terms and conditions.

Editor's Picks

EUR/USD bounces toward 1.1750 as US Dollar loses strength

EUR/USD returned to the 1.1750 price zone in the American session on Friday, despite falling Wall Street, which indicates risk aversion. Trading conditions remain thin following the New Year holiday and ahead of the weekend, with the focus shifting to US employment and European data scheduled for next week.

GBP/USD nears 1.3500, holds within familiar levels

After testing 1.3400 on the last day of 2025, GBP/USD managed to stage a rebound. Nevertheless, the pair finds it difficult to gather momentum and trades with modest intraday gains at around 1.3490 as market participants remain in holiday mood.

Gold trims intraday gains, approaches $4,300

Gold retreated sharply from the $4,400  area and trades flat for the day in the $4,320 price zone. Choppy trading conditions exacerbated the intraday decline, although XAU/USD bearish case is out of the picture, considering growing expectations for a dovish Fed and persistent geopolitical tensions.

Cardano gains early New Year momentum, bulls target falling wedge breakout

Cardano kicks off the New Year on a positive note and is extending gains, trading above $0.36 at the time of writing on Friday. Improving on-chain and derivatives data point to growing bullish interest, while the technical outlook keeps an upside breakout in focus.

Economic outlook 2026-2027 in advanced countries: Solidity test

After a year marked by global economic resilience and ending on a note of optimism, 2026 looks promising and could be a year of solid economic performance. In our baseline scenario, we expect most of the supportive factors at work in 2025 to continue to play a role in 2026.

Crypto market outlook for 2026

Year 2025 was volatile, as crypto often is.  Among positive catalysts were favourable regulatory changes in the U.S., rise of Digital Asset Treasuries (DAT), adoption of AI and tokenization of Real-World-Assets (RWA).