|

USD/MXN Price Analysis: Manages to hold above 50-day SMA ahead of FOMC

  • USD/MXN oscillates in a range on Wednesday, around the 61.8% Fibo. level.
  • The setup favours bears and supports prospects for some meaningful downfall.
  • A move beyond the 17.20-25 confluence hurdle will negate the bearish outlook.

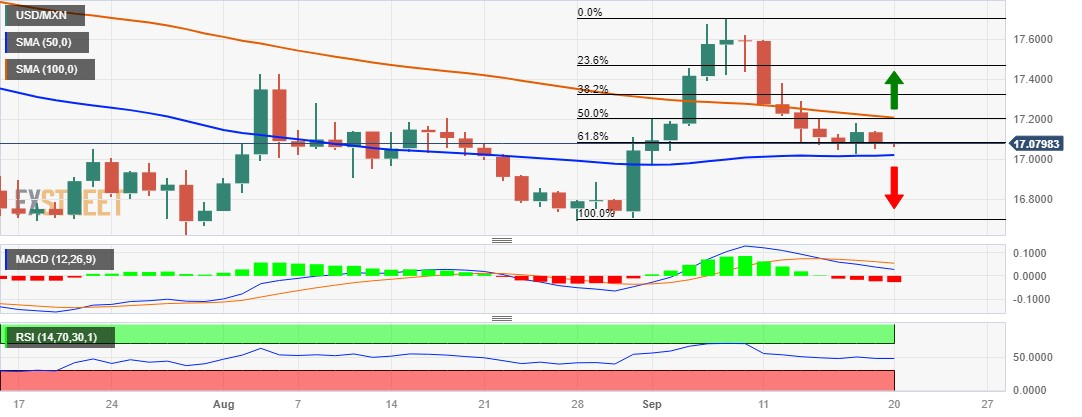
The USD/MXN remains on the defensive through the Asian session on Wednesday and is currently placed around the 17.0760-17.0755 area, representing the 61.8% Fibonacci retracement level of the rally from the August monthly swing low. Spot prices, however, manage to hold above a two-week low touched on Monday and the 50-day Simple Moving Average (SMA), pegged near the 17.0235 region, which should act as a key pivotal point ahead of the highly-anticipated FOMC monetary policy decision.

Oscillators on the daily chart, meanwhile, have been gaining negative traction and suggest that the path of least resistance for the USD/MXN pair is to the downside. That said, it will still be prudent to wait for a sustained break below the aforementioned support before positioning for further losses. Spot prices might then turn vulnerable to weaken further below the 17.0000 psychological mark and test the 16.8885 support zone. The downward trajectory could get extended further towards the multi-year trough, near the 16.6945 region touched in August.

On the flip side, the overnight swing high, around the 17.1420-17.1425 area now seems to act as an immediate hurdle ahead of the weekly top, near the 17.1825 region touched on Monday. Any subsequent move up is more likely to confront stiff resistance and remain capped near the 17.2060-17.2280 confluence, comprising the 50% Fibo. level and the 100-day SMA. Some follow-through buying, however, should lift the USD/MXN pair to the 38.2% Fibo. level, around the 17.3300 region en route to the 23.6% Fibo. barrier near the 17.4775 area.

The next relevant hurdle is pegged near the multi-month top, around the 17.7090-17.7095 zone, which if cleared decisively will be seen as a fresh trigger for bullish traders and set the stage for a further near-term appreciating move for the USD/MXN pair.

USD/MXN daily chart

fxsoriginal

Technical levels to watch

USD/MXN

Overview
Today last price17.0811
Today Daily Change-0.0006
Today Daily Change %-0.00
Today daily open17.0817
 
Trends
Daily SMA2017.1131
Daily SMA5017.0175
Daily SMA10017.2163
Daily SMA20017.9303
 
Levels
Previous Daily High17.1424
Previous Daily Low17.0548
Previous Weekly High17.5959
Previous Weekly Low17.0504
Previous Monthly High17.4274
Previous Monthly Low16.6945
Daily Fibonacci 38.2%17.0882
Daily Fibonacci 61.8%17.1089
Daily Pivot Point S117.0435
Daily Pivot Point S217.0054
Daily Pivot Point S316.956
Daily Pivot Point R117.1311
Daily Pivot Point R217.1805
Daily Pivot Point R317.2187

Author

Haresh Menghani

Haresh Menghani is a detail-oriented professional with 10+ years of extensive experience in analysing the global financial markets.

More from Haresh Menghani
Share:

Markets move fast. We move first.

Orange Juice Newsletter brings you expert driven insights - not headlines. Every day on your inbox.

By subscribing you agree to our Terms and conditions.

Editor's Picks

EUR/USD retreats below 1.1750 on modest USD recovery

EUR/USD stays under modest bearish pressure and trades below 1.1750 on Friday. Although trading conditions remain thin following the New Year holiday and ahead of the weekend, the modest recovery seen in the US Dollar causes the pair to edge lower. The economic calendar will not feature any high-impact data releases.

GBP/USD struggles to gain traction, stabilizes above 1.3450

After testing 1.3400 on the last day of 2025, GBP/USD managed to stage a rebound. Nevertheless, the pair finds it difficult to gather momentum and moves sideways above 1.3450 as market participants remain in holiday mood.

Gold climbs toward $4,400 following deep correction

Gold reverses its direction and advances toward $4,400 after suffering heavy losses amid profit-taking before the New Year holiday. Growing expectations for a dovish Fed policy and persistent geopolitical risks seem to be helping XAU/USD stretch higher.

Cardano gains early New Year momentum, bulls target falling wedge breakout

Cardano kicks off the New Year on a positive note and is extending gains, trading above $0.36 at the time of writing on Friday. Improving on-chain and derivatives data point to growing bullish interest, while the technical outlook keeps an upside breakout in focus.

Economic outlook 2026-2027 in advanced countries: Solidity test

After a year marked by global economic resilience and ending on a note of optimism, 2026 looks promising and could be a year of solid economic performance. In our baseline scenario, we expect most of the supportive factors at work in 2025 to continue to play a role in 2026.

Crypto market outlook for 2026

Year 2025 was volatile, as crypto often is.  Among positive catalysts were favourable regulatory changes in the U.S., rise of Digital Asset Treasuries (DAT), adoption of AI and tokenization of Real-World-Assets (RWA).