|

USD/MXN Price Analysis: Flirts with 38.2% Fibo. around 18.2500, bulls have the upper hand

  • USD/MXN attracts fresh buyers on Monday, albeit lacks follow-through beyond the 38.2% Fibo. level.
  • The technical setup favours bulls and supports prospects for an extension of a one-month-old uptrend.
  • A convincing break below the 23.6% Fibo. level is needed to negate the near-term positive outlook.

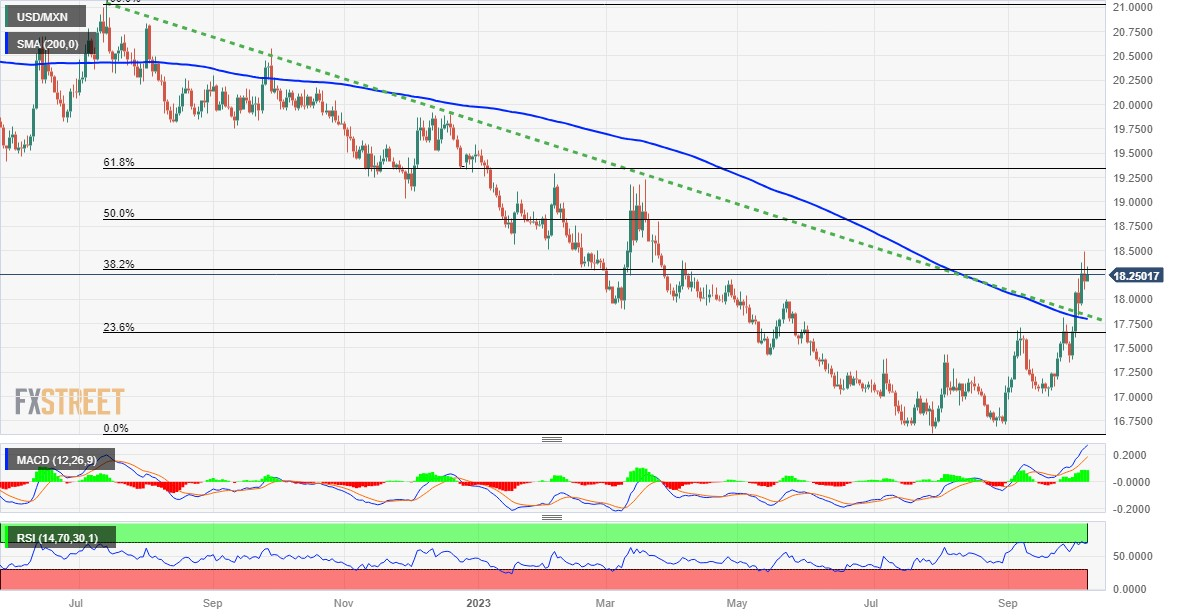
The USD/MXN pair regains some positive traction on the first day of a new week and reverses a part of Friday's retracement slide from the vicinity of the mid-18.0000s, or its highest level since March 24. Spot prices, however, struggle to capitalize on the uptick beyond the 38.2% Fibonacci retracement level of the steep fall witnessed in July and currently trade around the 18.2475 region, still up over 0.35% for the day.

Looking at the broader picture, the recent breakout through the 17.8400-17.8555 confluence, comprising a technically significant 200-day Simple Moving Average (SMA) and a multi-month-old descending trend-line, favours bullish traders. That said, the Relative Strength Index (RSI) on the daily chart is flashing slightly overbought conditions and holding back bulls from placing fresh bets around the USD/MXN pair.

Hence, it will be prudent to wait for some near-term consolidation or a modest pullback before positioning for an extension of the recent well-established uptrend witnessed over the past month or so. Any corrective decline, meanwhile, is likely to attract fresh buyers near the 18.0000 mark. This should help limit the downside for the USD/MXN pair near the aforementioned confluence resistance breakpoint near the 17.8555-17.8400 area.

The next relevant support is pegged near the 23.6% Fibo. level, around the 17.6635 region, which if broken decisively will negate the positive outlook and shift the near-term bias back in favour of bearish traders. The USD/MXN pair might then accelerate the slide further towards the 17.4200-17.3785 horizontal support en route to the 17.0550-17.0245 region before eventually dropping to test sub-17.0000 levels.

On the flip side, momentum beyond the 38.2% Fibo. level is likely to confront some resistance near Friday's swing high, around the 18.4935 region. Some follow-through buying has the potential to lift the USD/MXN pair further to the 18.7980-18.8245 area, representing 50% Fibo. level. A sustained strength beyond the latter will be seen as a fresh trigger for bulls and pave the way for a further near-term appreciating move.

USD/MXN daily chart

fxsoriginal

Technical levels to watch

USD/MXN

Overview
Today last price18.2436
Today Daily Change0.0611
Today Daily Change %0.34
Today daily open18.1825
 
Trends
Daily SMA2017.4658
Daily SMA5017.2277
Daily SMA10017.2095
Daily SMA20017.8037
 
Levels
Previous Daily High18.4934
Previous Daily Low18.104
Previous Weekly High18.4934
Previous Weekly Low17.3786
Previous Monthly High17.8174
Previous Monthly Low16.9727
Daily Fibonacci 38.2%18.2528
Daily Fibonacci 61.8%18.3447
Daily Pivot Point S118.0265
Daily Pivot Point S217.8706
Daily Pivot Point S317.6371
Daily Pivot Point R118.4159
Daily Pivot Point R218.6494
Daily Pivot Point R318.8053

Author

Haresh Menghani

Haresh Menghani is a detail-oriented professional with 10+ years of extensive experience in analysing the global financial markets.

More from Haresh Menghani
Share:

Markets move fast. We move first.

Orange Juice Newsletter brings you expert driven insights - not headlines. Every day on your inbox.

By subscribing you agree to our Terms and conditions.

Editor's Picks

EUR/USD bounces toward 1.1750 as US Dollar loses strength

EUR/USD returned to the 1.1750 price zone in the American session on Friday, despite falling Wall Street, which indicates risk aversion. Trading conditions remain thin following the New Year holiday and ahead of the weekend, with the focus shifting to US employment and European data scheduled for next week.

GBP/USD nears 1.3500, holds within familiar levels

After testing 1.3400 on the last day of 2025, GBP/USD managed to stage a rebound. Nevertheless, the pair finds it difficult to gather momentum and trades with modest intraday gains at around 1.3490 as market participants remain in holiday mood.

Gold trims intraday gains, approaches $4,300

Gold retreated sharply from the $4,400  area and trades flat for the day in the $4,320 price zone. Choppy trading conditions exacerbated the intraday decline, although XAU/USD bearish case is out of the picture, considering growing expectations for a dovish Fed and persistent geopolitical tensions.

Cardano gains early New Year momentum, bulls target falling wedge breakout

Cardano kicks off the New Year on a positive note and is extending gains, trading above $0.36 at the time of writing on Friday. Improving on-chain and derivatives data point to growing bullish interest, while the technical outlook keeps an upside breakout in focus.

Economic outlook 2026-2027 in advanced countries: Solidity test

After a year marked by global economic resilience and ending on a note of optimism, 2026 looks promising and could be a year of solid economic performance. In our baseline scenario, we expect most of the supportive factors at work in 2025 to continue to play a role in 2026.

Crypto market outlook for 2026

Year 2025 was volatile, as crypto often is.  Among positive catalysts were favourable regulatory changes in the U.S., rise of Digital Asset Treasuries (DAT), adoption of AI and tokenization of Real-World-Assets (RWA).