|

USD/MXN Price Analysis: Bears turn cautious amid oversold RSI, not ready to give up yet

  • USD/MXN continues with its struggle to gain any traction and languishes near a multi-year low.
  • The formation of a descending channel points to a well-established short-term bearish trend.
  • The RSI on the daily chart is still flashing oversold conditions and holding back bearish traders.

The USD/MXN pair struggles to capitalize on the previous day's modest rebound from the 17.0245 area, or its lowest level since December 2015 and oscillates in a narrow range through the early part of the European session on Tuesday. The pair currently trades just below the 17.1000 round figure, nearly unchanged for the day, and seems vulnerable to sliding further.

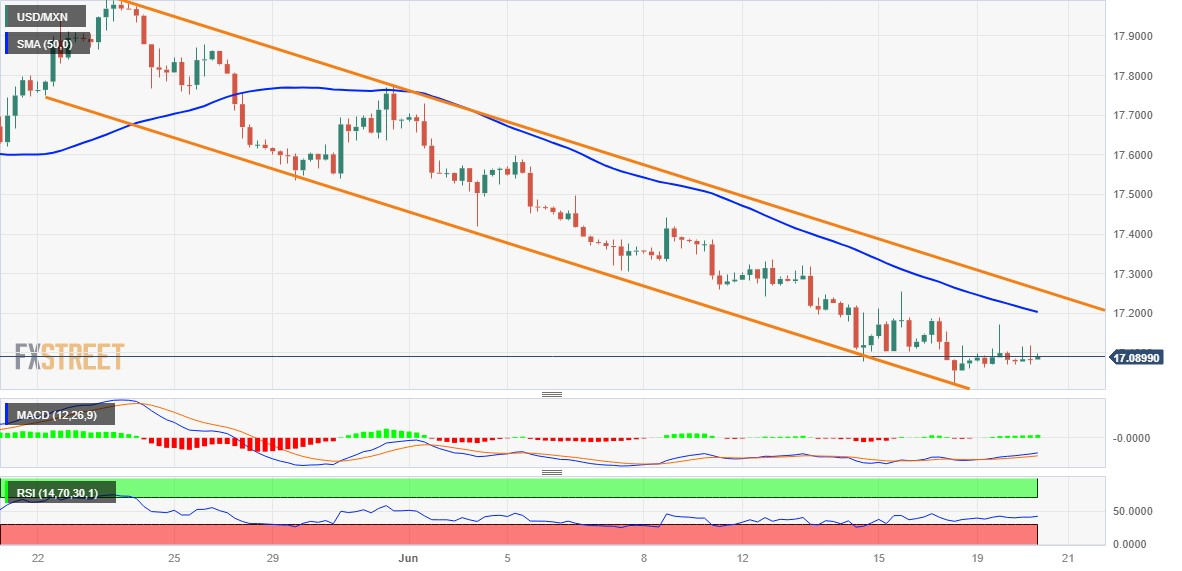
From a technical perspective, the recent downfall from the vicinity of the 18.00 round-figure mark, or the May swing high, has been along a downward-sloping channel. This points to a well-established short-term bearish trend and suggests that the path of least resistance for the USD/MXN pair is to the downside. That said, the Relative Strength Index (RSI) on the daily chart is still flashing oversold conditions and holding back traders from placing fresh bearish bets around the pair.

Nevertheless, the lack of any meaningful buying suggests that the downtrend is still far from being over. Hence, any recovery attempt could attract fresh sellers near the 17.20-17.25 area, which coincides with the 50-period Simple Moving Average (SMA) on the 4-hour chart. This is closely followed by the top end of the aforementioned channel and should act as a pivotal point. A convincing breakout will suggest that the USD/MXN pair has formed a bottom and pave the way for additional gains.

On the flip side, the multi-year low, around the 17.0245-17.0240 zone could protect the immediate downside ahead of the trend-channel support, currently pegged just below the 17.0000 psychological mark. Some follow-through selling will be seen as a fresh trigger for bearish traders and make the USD/MXN pair vulnerable to accelerate the fall towards the 16.60-16.55 region en route to the November 2015 swing low, around the 16.35 region.

USD/MXN 4-hour chart

fxsoriginal

Key levels to watch

USD/MXN

Overview
Today last price17.0883
Today Daily Change0.0079
Today Daily Change %0.05
Today daily open17.0804
 
Trends
Daily SMA2017.4535
Daily SMA5017.7094
Daily SMA10018.0832
Daily SMA20018.8332
 
Levels
Previous Daily High17.1724
Previous Daily Low17.061
Previous Weekly High17.3353
Previous Weekly Low17.0243
Previous Monthly High18.078
Previous Monthly Low17.4203
Daily Fibonacci 38.2%17.1299
Daily Fibonacci 61.8%17.1036
Daily Pivot Point S117.0368
Daily Pivot Point S216.9932
Daily Pivot Point S316.9255
Daily Pivot Point R117.1482
Daily Pivot Point R217.216
Daily Pivot Point R317.2596

Author

Haresh Menghani

Haresh Menghani is a detail-oriented professional with 10+ years of extensive experience in analysing the global financial markets.

More from Haresh Menghani
Share:

Editor's Picks

GBP/USD clings to daily gains near 1.3350

GBP/USD holds just in positive territory around 1.3350 on Friday as the Greenback keeps a vacillating price action. With Fed rate hike expectations easing and US markets closed for the Independence Day holiday, Cable remains on track to post solid weekly gains.

EUR/USD remains sidelined around 1.1440

EUR/USD holds on to its recent gains and consolidates around 1.1440 at the end of the week as the US Dollar lacks clear direction. In the meantime, trading conditions remain subdued, with volatility constrained by the closure of US markets for the Independence Day holiday.

Gold flirts with two-week highs, targets $4,200

Gold extends its recovery for a third straight day, advancing toward the $4,200 mark per troy ounce on Friday. The precious metal looks set to snap a four-week losing streak as softer-than-expected June US NFP data prompt investors to scale back expectations of further Fed tightening.

Crypto Today: Bitcoin, Ethereum, XRP advance amid renewed capital inflows

Bitcoin maintains its upward momentum, holding above the $61,000 mark at the time of writing on Friday. Major altcoins such as Ethereum and Ripple are also posting gains, signaling a modest uptick in market sentiment and renewed risk appetite among investors.

The Iran war failed to trigger a recession. Can the US economy keep defying expectations?

Nearly four months after the start of the Iran war, the US economy remains remarkably resilient. While the conflict initially triggered a severe disruption to global energy markets and a sharp rise in Oil prices, recent diplomatic progress between Washington and Tehran has eased concerns about a prolonged supply shock.

Kevin Warsh offers no policy clues: Why markets still got their answer

Financial markets came to Sintra looking for clues about the Federal Reserve's (Fed) next move. They largely left with confirmation that Fed Chair Kevin Warsh intends to make those clues much harder to find.