USD/MXN Price Analysis: Bears occupy the driver’s seat below 18.10 key resistance


  • USD/MXN takes offers to reverse the week-start corrective bounce off multi-month low.
  • Bearish MACD signals, sustained trading below 50-DMA keep sellers hopeful.
  • Convergence of previous support line from November 2022, one-month-old descending trend line appears crucial hurdle towards the north.

USD/MXN bears are back to the table, following a one-day absence, as the Mexican Peso (MXN) pair drops to 17.99, down 0.10% intraday during early Tuesday in Europe.

In doing so, the currency pair reverses the previous day’s corrective bounce from the lowest levels since April 2018.

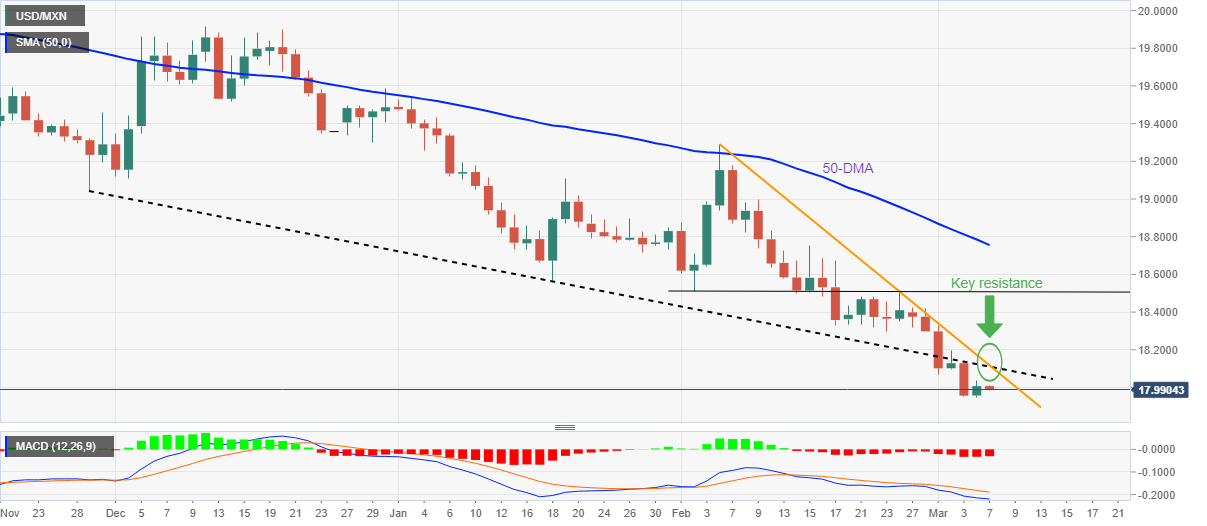
It’s worth noting that the USD/MXN pair’s latest losses take clues from the bearish MACD signals, as well as the sustained trading below the 50-DMA. Adding strength to the bearish bias could be the quote’s failure to cross the $1,810 resistance confluence during the previous day’s rebound.

That said, a downward-sloping trend line from early February and a 14-week-old descending trend line, previous support, together constitute the 18.10 resistance confluence.

Should the quote rises past the 18.10 hurdle, the pair’s run-up towards a five-week-old horizontal resistance near 18.50 can’t be ruled out. However, the USD/MXN bears remain hopeful unless the quote trades below the 50-DMA level of 18.75.

On the contrary, the latest bottom of around 17.95 and April 2018 low of 17.90 lure the USD/MXN pair sellers of late.

Following that, September 2017 low and the year 2017 trough, close to 17.60 and 17.45 in that order, may flash on the bear’s radar.

USD/MXN: Daily chart

Trend: Further downside expected

Additional important levels

Overview
Today last price 17.9916
Today Daily Change -0.0157
Today Daily Change % -0.09%
Today daily open 18.0073
 
Trends
Daily SMA20 18.4356
Daily SMA50 18.7851
Daily SMA100 19.1949
Daily SMA200 19.6738
 
Levels
Previous Daily High 18.0394
Previous Daily Low 17.9495
Previous Weekly High 18.4235
Previous Weekly Low 17.9541
Previous Monthly High 19.2901
Previous Monthly Low 18.2954
Daily Fibonacci 38.2% 18.0051
Daily Fibonacci 61.8% 17.9839
Daily Pivot Point S1 17.9581
Daily Pivot Point S2 17.9088
Daily Pivot Point S3 17.8682
Daily Pivot Point R1 18.048
Daily Pivot Point R2 18.0887
Daily Pivot Point R3 18.1379


Share: Feed news

Information on these pages contains forward-looking statements that involve risks and uncertainties. Markets and instruments profiled on this page are for informational purposes only and should not in any way come across as a recommendation to buy or sell in these assets. You should do your own thorough research before making any investment decisions. FXStreet does not in any way guarantee that this information is free from mistakes, errors, or material misstatements. It also does not guarantee that this information is of a timely nature. Investing in Open Markets involves a great deal of risk, including the loss of all or a portion of your investment, as well as emotional distress. All risks, losses and costs associated with investing, including total loss of principal, are your responsibility. The views and opinions expressed in this article are those of the authors and do not necessarily reflect the official policy or position of FXStreet nor its advertisers. The author will not be held responsible for information that is found at the end of links posted on this page.

If not otherwise explicitly mentioned in the body of the article, at the time of writing, the author has no position in any stock mentioned in this article and no business relationship with any company mentioned. The author has not received compensation for writing this article, other than from FXStreet.

FXStreet and the author do not provide personalized recommendations. The author makes no representations as to the accuracy, completeness, or suitability of this information. FXStreet and the author will not be liable for any errors, omissions or any losses, injuries or damages arising from this information and its display or use. Errors and omissions excepted.

The author and FXStreet are not registered investment advisors and nothing in this article is intended to be investment advice.

Recommended content


Recommended content

Editors’ Picks

AUD/USD jumps above 0.6500 after hot Australian CPI data

AUD/USD jumps above 0.6500 after hot Australian CPI data

AUD/USD extended gains and recaptured 0.6500 in Asian trading, following the release of hotter-than-expected Australian inflation data. The Australian CPI rose 1% in QoQ in Q1 against 0.8% forecast, providing extra legs to the Australian Dollar upside. 

AUD/USD News

USD/JPY hangs near 34-year high at 154.88 as intervention risks loom

USD/JPY hangs near 34-year high at 154.88 as intervention risks loom

USD/JPY is sitting at a multi-decade high of 154.88 reached on Tuesday. Traders refrain from placing fresh bets on the pair as Japan's FX intervention risks loom. Broad US Dollar weakness also caps the upside in the major. US Durable Goods data are next on tap. 

USD/JPY News

Gold price cautious despite weaker US Dollar and falling US yields

Gold price cautious despite weaker US Dollar and falling US yields

Gold retreats modestly after failing to sustain gains despite fall in US Treasury yields, weaker US Dollar. XAU/USD struggles to capitalize following release of weaker-than-expected S&P Global PMIs, fueling speculation about potential Fed rate cuts.

Gold News

Ethereum ETF issuers not giving up fight, expert says as Grayscale files S3 prospectus

Ethereum ETF issuers not giving up fight, expert says as Grayscale files S3 prospectus

Ethereum exchange-traded funds theme gained steam after the landmark approval of multiple BTC ETFs in January. However, the campaign for approval of this investment alternative continues, with evidence of ongoing back and forth between prospective issuers and the US SEC.

Read more

US versus the Eurozone: Inflation divergence causes monetary desynchronization

US versus the Eurozone: Inflation divergence causes monetary desynchronization

Historically there is a very close correlation between changes in US Treasury yields and German Bund yields. This is relevant at the current juncture, considering that the recent hawkish twist in the tone of the Fed might continue to push US long-term interest rates higher and put upward pressure on bond yields in the Eurozone.

Read more

Forex MAJORS

Cryptocurrencies

Signatures