USD/MXN jumps from weekly lows amid soft US housing data
- USD/MXN is riding the uptick from Tuesday after June’s Retail Sales data revealed a moderate rise of 0.2% MoM.
- The US Department of Commerce revealed an -8.0% MoM drop in Housing Starts, a significant decrease from the previous month’s 15.7% increase.
- Building Permits also dropped by -3.7% MoM, compared to a 5.6% increase in May.

USD/MXN bounces from weekly lows but is still under pressure exchanging hands below the 17.00 figure for the fifth consecutive day. Soft housing data in the United States (US) and the absence of economic data releases in Mexico keep the USD/MXN pair trading within familiar levels. The USD/MXN is trading at 16.7770 after hitting a daily low of 16.7232.
USD/MXN trades below 17.00 for five days in a row due to interest rate differentials
Latest data revealed by the US Department of Commerce shows that Housing Starts plummeted -8.0% MoM, below the prior month's 15.7% increase, which was the highest pace in 11 months. Housing starts decelerated from 1.559M to 1.434M. Building Permits dropped -3.7% MoM, vs. May 5.6%, as permits dropped from 1.496M to 1.440M.
USD/MXN traders did not react to the data, as they continue to ride the uptick from Tuesday generated after June’s Retail Sales data. Figures revealed yesterday showed sales rose moderately by 0.2% MoM, lower than May upward revised figures at 0.5%, but still showing resilience in consumer spendingdespite the 500 basis points (bps) of tightening by the US Federal Reserve (Fed).
Regarding the Fed, expectations for a 25-bps rate hike in July are priced in, as shown by the CME FedWatch Tool. However, speculators seem confident that the Fed will not raise rates past the July meeting, and expectations for the first rate cut are eyed by March 2024.
That has underpinned the Greenback, as the US Dollar Index (DXY) shows. The DXY, which measures the performance of the US Dollar vs. a basket of six currencies, edges up 0.43%, up at 100.352.
Given the fundamental backdrop, with the US Federal Reserve expected to lift rates and pause while the Bank of Mexico has maintained rates unchanged at 11.25%, the USD/MXN could continue to trade sideways. Nevertheless, USD/MXN traders must be aware that expectations for Banxico’s first rate cut loom towards the end of 2023, which could pave the way for a recovery of the pair.
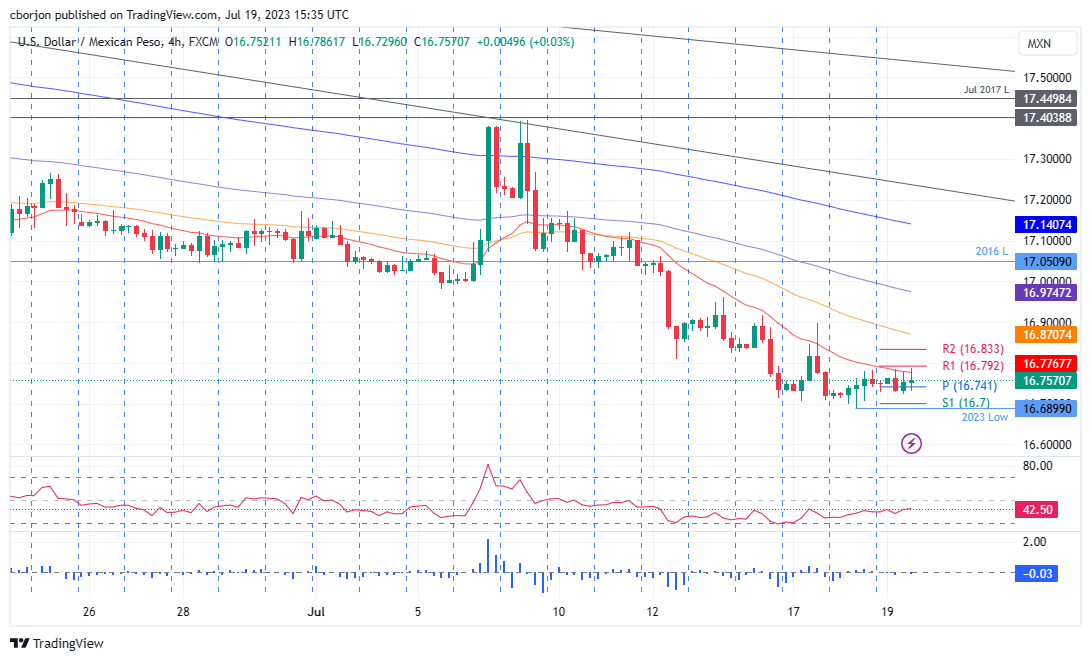
USD/MXN Price Analysis: Technical outlook
The USD/MXN daily chart portrays the pair as downward biased, with the first resistance level that could trigger a shift to a neutral bias at around the 17.0000 figure, as the 20-day Exponential Moving Average (EMA) sits at 16.9847. Otherwise, the USD/MXN would continue to slide, on its way to the October 2015 low of 16.3267. From an intraday perspective, the 4-hour chart suggests the Mexican Peso (MXN) is weakening toward the R1 daily pivot point at 16.7927, which, once breached, could expose the R2 pivot at 16.8339 past yesterday’s high of 16.7819. Immediate support lies at the YTD low of 16.6899.
Author

Christian Borjon Valencia
FXStreet
Markets analyst, news editor, and trading instructor with over 14 years of experience across FX, commodities, US equity indices, and global macro markets.


