|

USD/MXN drops and remains below 17.0000 due to US inflation cooling down, risk-on mood

  • USD/MXN recovers slightly after touching multi-year lows of 16.8083 but stays below the 17.0000 figure.
  • Initial Jobless Claims in the US rose less than expected, while US Producer Price Index (PPI) for June grew by 0.1% MoM, less than estimates.
  • With no Mexican economic data, USD/MXN traders are focused on US dynamics.

USD/MXN resumes its downtrend after touching muti-year lows of 16.8083, remains below the 17.0000 figure on Thursday after data from the United States (US) shows the Federal Reserve’s (Fed) job is about to be achieved, as inflation continues to edge lower. At the time of writing, the USD/MXN is trading at 16.8682 after hitting a daily high of 16.9619.

Mexican peso gains ground as US Dollar weakens amid lower-than-expected jobless claims, PPI

The USD/MXN drops due to improved risk appetite, to the detriment of safe-haven peers, like the US Dollar (USD). Data from the US Department of Labor (DoL) revealed that Initial Jobless Claims for the last week climbed less than estimates of 250K, standing at 237K. The Fed’s Beige Book showed that demand for labor “remained healthy” in June, though it noted that hiring “was getting more targeted and selective.”

At the same time, the US Producer Price Index (PPI) for June expanded by 0.1% MoM, exceeding May’s 0.4% plunge but was beneath estimates of 0.2%. On year-over-year (YoY) figures, PPI grew 0.1%, below forecasts of 0.4%, while the Core PPI, which excludes volatile items, increased 0.1% MoM, unchanged from May, accelerating below estimates of 0.2%. Yearly Core PPI cooled down compared to expectations of 2.6% and came at 2.4%. Hence PPI data followed suit with a soft US CPI report that could refrain Fed officials from lifting rates twice, as they previously commented after the FOMC’s June meeting.

An absent Mexican economic docket leaves USD/MXN traders focused on the US dynamics. As long as the interest rate differential between the US and Mexico favors the latter, further downside is expected. However, traders must know that political risks are beginning to boil in Mexico as general elections loom for June 2024.

USD/MXN Price Analysis: Technical outlook

USD/MXN Daily chart

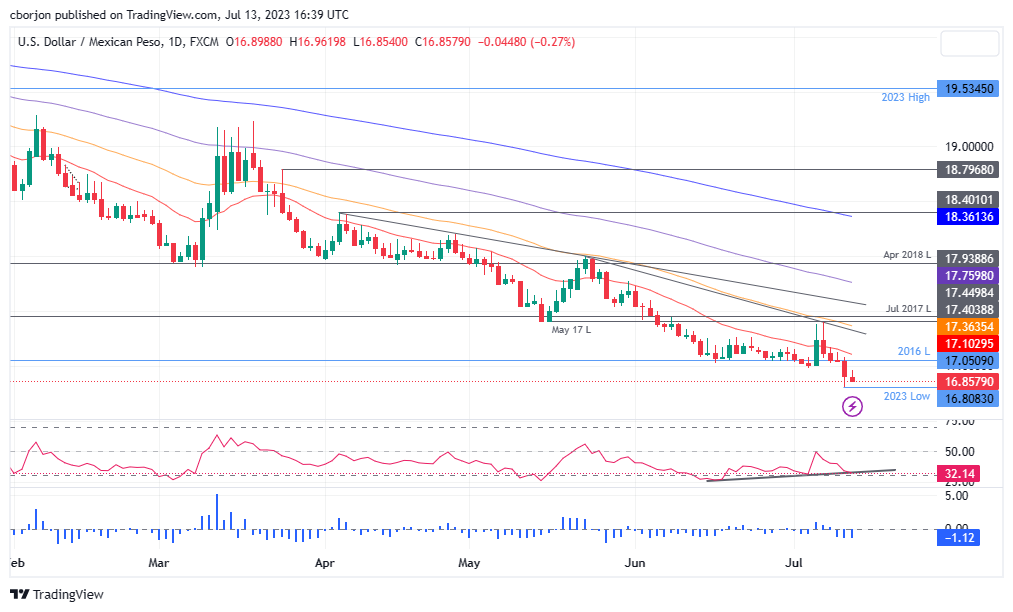
The USD/MXN downtrend would likely continue as the pair remains below the 17.00 mark. Sellers eyeing the October 2015 swing low of 16.3267 keeps the USD/MXN pressured, with the next support eyed at 16.5000 before sellers reclaim the latter. The following support would emerge at 16.00. Conversely, if USD/MXN buyers regain the 17.0000 figure, it could exacerbate a recovery toward the 20-day Exponential Moving Average (EMA) at 17.1073 short term. The USD/MXN must surpass the 17.4038 area to switch the bias to neutral.

USD/MXN

Overview
Today last price16.8878
Today Daily Change-0.0142
Today Daily Change %-0.08
Today daily open16.902
 
Trends
Daily SMA2017.1012
Daily SMA5017.3945
Daily SMA10017.8178
Daily SMA20018.5794
 
Levels
Previous Daily High17.0645
Previous Daily Low16.8085
Previous Weekly High17.3957
Previous Weekly Low16.9803
Previous Monthly High17.7286
Previous Monthly Low17.0243
Daily Fibonacci 38.2%16.9063
Daily Fibonacci 61.8%16.9667
Daily Pivot Point S116.7855
Daily Pivot Point S216.669
Daily Pivot Point S316.5295
Daily Pivot Point R117.0415
Daily Pivot Point R217.181
Daily Pivot Point R317.2975

Author

Christian Borjon Valencia

Christian Borjon began his career as a retail trader in 2010, mainly focused on technical analysis and strategies around it. He started as a swing trader, as he used to work in another industry unrelated to the financial markets.

More from Christian Borjon Valencia
Share:

Markets move fast. We move first.

Orange Juice Newsletter brings you expert driven insights - not headlines. Every day on your inbox.

By subscribing you agree to our Terms and conditions.

Editor's Picks

EUR/USD hangs close to 1.1750, with eyes on Fedspeak

EUR/USD is holding its retreat from 10-week highs near 1.1750 in the European session on Friday, capped by a modest rebound in the US Dollar.  The potential downside for the pair might be limited amid expectations of divergent Fed-ECB monetary policy outlooks. Fedspeak is awaited, 

GBP/USD holds steady below 1.3400 after mixed UK data

GBP/USD is keeping its range trade intact below 1.3400 in European trading on Friday. The UK GDP unexpectedly fell by 0.1% in October vs. a 0.1% growth expected, while the Manufacturing Production rose 0.5% over the month in the same period, missing the estimated 1% increase. Mixed UK data have little to no impact on the Pound Sterling. 

Gold extends rally beyond $4,300, fresh high since October 21 amid dovish Fed bets

Gold prolongs its uptrend for the fourth straight day and climbs beyond the $4,300 mark, hitting a fresh high since October 21 during the first half of the European session on Friday. The US Dollar struggles to attract any meaningful buyers and remains close to a two-month low, touched on Thursday, amid the Federal Reserve's dovish outlook.

Litecoin Price Forecast: LTC struggles to extend gains, bullish bets at risk

Litecoin (LTC) price steadies above $80 at press time on Friday, following a reversal from the $87 resistance level on Wednesday. Derivatives data suggests a bullish positional buildup while the LTC futures Open Interest declines, flashing a long squeeze risk.

Big week ends with big doubts

The S&P 500 continued to push higher yesterday as the US 2-year yield wavered around the 3.50% mark following a Federal Reserve (Fed) rate cut earlier this week that was ultimately perceived as not that hawkish after all. The cut is especially boosting the non-tech pockets of the market.

Aave Price Forecast: AAVE primed for breakout as bullish signals strengthen

Aave (AAVE) price is trading above $204 at the time of writing on Friday and approaching the upper boundary of its descending parallel channel; a breakout from this structure would favor the bulls.