|

USD/MXN dips on solid Mexican retail sales as the economy continues to grow

  • Mexican Retail Sales for June surge to 2.9% MoM, significantly outpacing the anticipated 0.9% growth.
  • Preliminary INEGI data indicates a 3.4% growth in Mexico’s economy for July.
  • Despite the US’s solid economic performance, the USD/MXN pair retreats, with the DXY index remaining almost flat at 103.353.

The USD/MXN drops below the 17.0500 figure after traveling from weekly highs of 17.2073, preparing to finish the week with modest gains of 0.14%. Usually, risk aversion sees flows toward the Greenback in emerging market currency pairs vs. the former, but not on this occasion. At the time of writing, the USD/MXN is trading at 17.0170, down 0.51%.

Mexican Peso gains traction on robust economic data, while the US maintains a restrictive monetary stance amidst solid retail sales

The Mexican Peso (MXN) recovered some ground after Retail Sales in June exceeded estimates according to the Instituto Nacional de Estadistica Geografia e Informatica (INEGI), with sales coming at 2.9% MoM, above a 0.9% expansion foreseen. Annually basis, sales jumped by 5.9%, crushing estimates of 2.9%. At the same time, a preliminary reading from INEGI showed that Mexican’s economy grew 3.4% in July.

It should be said the Bank of Mexico (Banxico), the Mexican central bank, has kept rates on hold during the last two meetings and is expected to keep them around 11.25% in the foreseeable future. Meanwhile, the swaps markets speculate Banxico would cut rates by the end of 2023.

Across the border, the US economic agenda revealed solid data during the week, led by retail sales pushing above forecasts and a robust labor market justifying the Federal Reserve’s (Fed) need to maintain its restrictive stance regarding monetary policy. The Fed’s latest monetary policy meeting minutes emphasized the US central bank commitment to bring inflation towards its 2% target, though some officials began to be cautious about upcoming meetings.

In the meantime, the US Dollar Index (DXY), a gauge of the buck’s value against a basket of six peers, hovered around two-month highs but retraced to 103.353, almost flat. The US Treasury bond yields pare some of its losses, with the US 10-year Treasury note yielding 4.255%, down two bps.

USD/MXN Price Analysis: Technical outlook

USD/MXN Daily chart

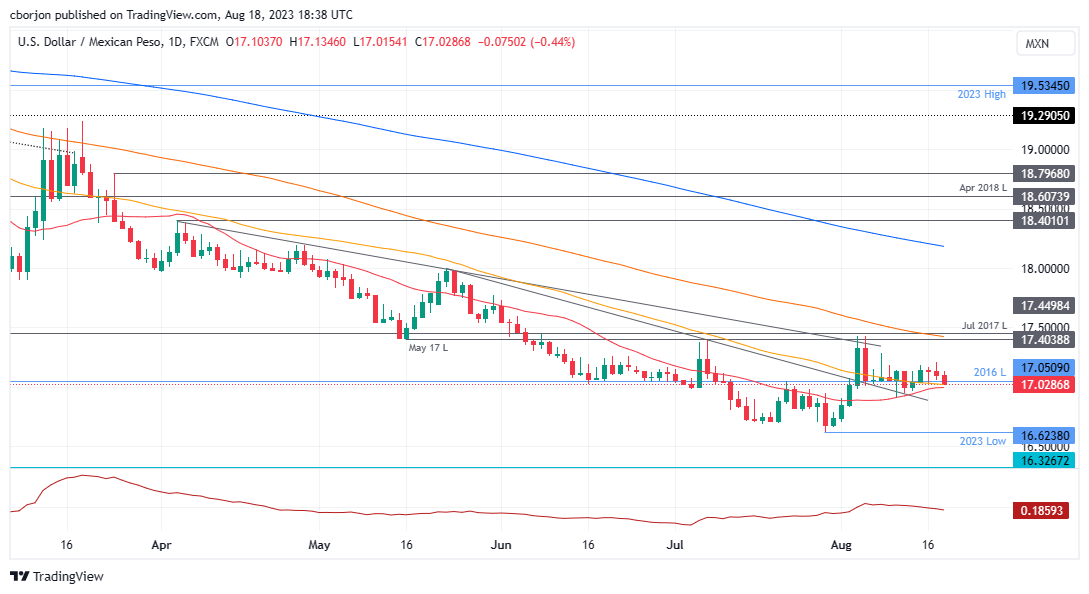
The USD/MXN bias remains downwards but it appears to have bottomed at around 17.0000. A daily close below the latter would expose the year-to-date (YTD) low of 16.6238, followed by the October 2015 swing low of 16.3267. Contrarily, if USD/MXN remains above 17.0000, the 20-day Moving Average (DMA) at 17.0189 would be up for grabs. 

USD/MXN

Overview
Today last price17.0351
Today Daily Change-0.0708
Today Daily Change %-0.41
Today daily open17.1059
 
Trends
Daily SMA2017.002
Daily SMA5017.0329
Daily SMA10017.4402
Daily SMA20018.2028
 
Levels
Previous Daily High17.2094
Previous Daily Low17.0601
Previous Weekly High17.2852
Previous Weekly Low16.9101
Previous Monthly High17.3957
Previous Monthly Low16.6258
Daily Fibonacci 38.2%17.1171
Daily Fibonacci 61.8%17.1524
Daily Pivot Point S117.0409
Daily Pivot Point S216.9759
Daily Pivot Point S316.8916
Daily Pivot Point R117.1902
Daily Pivot Point R217.2744
Daily Pivot Point R317.3394

Author

Christian Borjon Valencia

Markets analyst, news editor, and trading instructor with over 14 years of experience across FX, commodities, US equity indices, and global macro markets.

More from Christian Borjon Valencia
Share:

Editor's Picks

GBP/USD bounces off lows, back above 1.3200

After bottoming out near 1.3160, GBP/USD manages to regain a bit of shine and reclaim the 1.3200 mark and beyond at the end of the week. Stronger-than-expected UK Retail Sales data seem to be helping the British Pound limit its losses, while the chaotic UK political environment keeps the bulls at bay for now.

EUR/USD looks consolidative around 1.1460

EUR/USD stages a modest rebound after slipping to a three-month low below 1.1420 at the end of the week. That said, the pair now looks to consolidate humble gains just above 1.1460 despite growing uncertainty surrounding the next round of US-Iran negotiations, which keeps the US Dollar’s downside contained.

Gold slips back to six-day lows, targets $4,100

Gold retreats for the third consecutive day on Friday, eroding gains seen in the first half of the week and approaching the key $4,100 mark per troy ounce. Indeed, the precious metal continues to face headwinds from the Fed's hawkish stance and renewed uncertainty surrounding the next round of US-Iran negotiations.

Breaking: Iran closes the Strait of Hormuz amid ceasefire deal violation
Iran says it is closing the Strait of Hormuz after accusing the United States (US) and Israel of violating the ceasefire. According to Iran, the decision came over the continued Israeli strikes in Lebanon. The Iranian Revolutionary Guard Corps Navy issued a warning to all vessels: "Do not approach the Strait of Hormuz; otherwise, your security will be jeopardized."
The Iran war didn't break the US economy, but what happens next?

Nearly four months after the start of the Iran war, the US economy remains remarkably resilient. While the conflict initially triggered a severe disruption to global energy markets and a sharp rise in Oil prices, recent diplomatic progress between Washington and Tehran has eased concerns about a prolonged supply shock.

Regime change: Inside Kevin Warsh's first move to make the Fed unreadable on purpose

The rate did not move. That was the least interesting thing about Kevin Warsh's first meeting in charge of the Fed. The FOMC held its benchmark at 3.50%-3.75% for the fourth straight meeting, exactly as priced, and then the new chair used his first press conference to dismantle the machinery the market has leaned on for a decade.