|

USD/JPY twisting on the north side of 147.50, Japan CPI ticks lower to 3.2%

  • USD/JPY strung up the middle for Friday after Thursday's reversal flows.
  • Japan's National CPI headline figure came in slightly below previous print, inflation cools slightly.
  • The Core Japanese National CPI stayed on the higher end than markets expected, steady for the annualized period into August.

The USD/JPY is holding steady with a bullish lean for early Friday trading, teasing into the 147.650 region as the Japanese Yen (JPY) eases on softly-declining national inflation figures.

Markets initially expected national Consumer Price Index (CPI) figures for Japan to step back slightly, with the core CPI (inflation less food price changes) printing in line with the previous figure of 3.1%, beating the median forecast of a flat 3%.

Read more:

Japan inflation: National CPI eases to 3.2% YoY in August vs. 3.3% prior

Friday's economic calendar isn't finished with the USD/JPY yet, with the Bank of Japan (BoJ) expected to give their latest inflation rate call. The BoJ is broadly forecast to keep their negative rate regime steady at -0.1%, but abnormally hawkish comments from BoJ officials recently have ramped up expectations of a potential policy adjustment from Japan's central bank.

Read more: 

Japan Interest Rate Decision Preview: Bank of Japan expected to stand pat despite Ueda hawkish hint

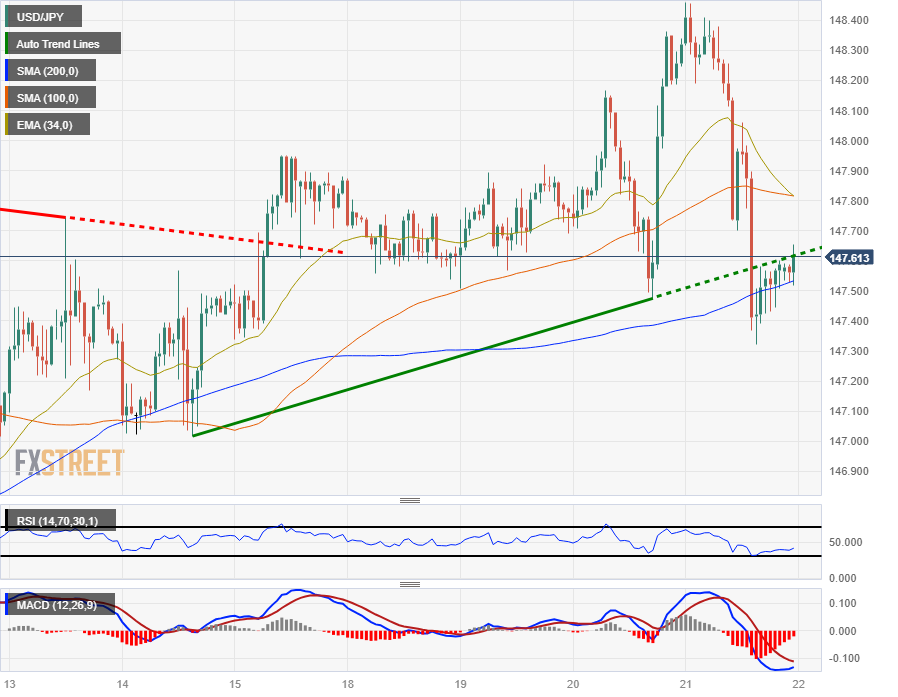
USD/JPY technical outlook

The USD/JPY pair is seeking higher territory early in Friday trading, probing for firmer ground above 147.50.

The pair got knocked off an up-and-down pattern through the midweek, peaking near 148.50 before checking the plumbing at 147.30.

The USD/JPY is now looking to stage a slow and steady recovery into the midrange after catching support from the 200-hour Simple Moving Average (SMA), and is facing descending technical resistance from the 100-hour SMA just north of 147.80.

On the daily charts, the USD/JPY is enjoying a consistent bullish trend, rising steadily from early 2023's lows near the 128.00 major handle, with prices seeing steady support from a bullish 34-day Exponential Moving Average (EMA) near 146.00.

USD/JPY hourly chart

USD/JPY technical levels

USD/JPY

Overview
Today last price147.61
Today Daily Change-0.74
Today Daily Change %-0.50
Today daily open148.35
 
Trends
Daily SMA20147
Daily SMA50144.35
Daily SMA100142.17
Daily SMA200137.53
 
Levels
Previous Daily High148.36
Previous Daily Low147.48
Previous Weekly High147.95
Previous Weekly Low145.9
Previous Monthly High147.38
Previous Monthly Low141.51
Daily Fibonacci 38.2%148.02
Daily Fibonacci 61.8%147.81
Daily Pivot Point S1147.76
Daily Pivot Point S2147.17
Daily Pivot Point S3146.87
Daily Pivot Point R1148.65
Daily Pivot Point R2148.95
Daily Pivot Point R3149.53

Author

Joshua Gibson

Joshua joins the FXStreet team as an Economics and Finance double major from Vancouver Island University with twelve years' experience as an independent trader focusing on technical analysis.

More from Joshua Gibson
Share:

Markets move fast. We move first.

Orange Juice Newsletter brings you expert driven insights - not headlines. Every day on your inbox.

By subscribing you agree to our Terms and conditions.

Editor's Picks

EUR/USD consolidates below 1.1700 as markets turn risk-averse

EUR/USD struggles to stage a rebound and trades near the lower limit of its weekly range below 1.1700 on Thursday. The US Dollar benefits from the cautious market stance and doesn't allow the pair to gain traction ahead of mid-tier data releases.

GBP/USD stays in red near 1.3450 on broad USD resilience

GBP/USD stays on the back foot after posting losses for two consecutive days and trades near 1.3450 on Thursday. The souring market mood amid simmering geopolitical tensions make it difficult for the pair to gain traction as focus shift to the the US labor market data.

Gold sticks to intraday losses below $4,450; seems vulnerable to slide further

Gold maintains its offered tone in the second half of the day and trades below $4,450 after posting daily losses on Wednesday. The downfall lacks any obvious fundamental catalyst and could be attributed to some follow-through profit-taking ahead of the release of the US Nonfarm Payrolls report on Friday. 

Pi Network flashes bearish potential as selling pressure mounts

Pi Network trades above $0.2000 at press time on Thursday, following a nearly 2% decline the previous day. Centralized Exchanges have received 1.90 million PI tokens over the last 24 hours, suggesting risk-off sentiment among holders. The technical outlook for the PI token remains bearish, with a risk of a cross below the 20-day Exponential Moving Average. 

2026 economic outlook: Clear skies but don’t unfasten your seatbelts yet

Most years fade into the background as soon as a new one starts. Not 2025: a year of epochal shifts, in which the macroeconomy was the dog that did not bark. What to expect in 2026? The shocks of 2025 will not be undone, but neither will they be repeated.

Pi Network Price Forecast: PI flashes bearish potential as selling pressure mounts

Pi Network trades above $0.2000 at press time on Thursday, following a nearly 2% decline the previous day. Centralized Exchanges have received 1.90 million PI tokens over the last 24 hours, suggesting risk-off sentiment among holders.