|

USD/JPY testing 151.00 as Greenback climbs for a third straight day

  • The USD/JPY is testing back into recent record highs as the Yen slumps.
  • Investors will be increasingly concerned of potential BoJ intervention the lower JPY goes.
  • Early Thursday sees Japan trade balance figures.

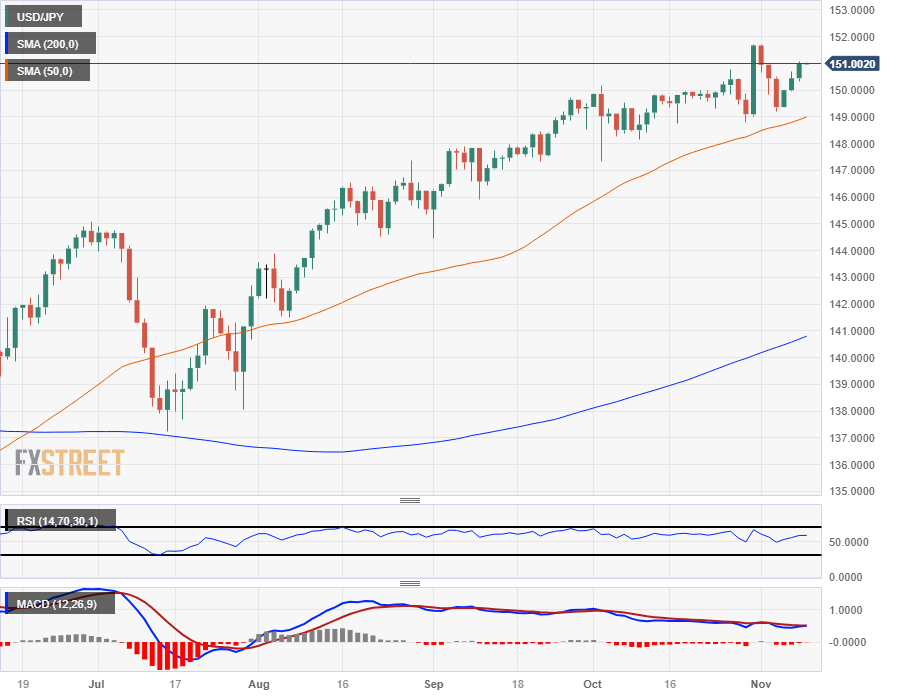
The USD/JPY has reclaimed the 151.00 handle heading into Thursday's market session after the US Dollar (USD) notched in a third straight green candle as the Yen (JPY) continues to slump against the broader market.

The Japanese Yen has continued to decline against its major counterparties with little else to do but go down as a hyper-dovish Bank of Japan (BoJ) hangs the Yen out to dry, though investors will begin to gnaw on the possibility of the BoJ intervening in currency markets to try and defend the beleaguered Yen.

The 150.00-and-above region has historically been a popular exchange level has been a popular intervention zone for the BoJ in the past.

Japan trade balance figures will print early during the Thursday Asia market session, and Japan's Current Account (non-seasonally-adjusted) for September is expected to increase from JPY 2.279 trillion to 3 trillion.

Japan Bank lending for the year into October is also expected to tick down from 2.9% to 2.8% as Japanese banks struggle to find people to lend to despite rock-bottom rates artificially suppressed into the basement and hyper-easy monetary policy that renders funding costs functionally zero.

USD/JPY Technical Outlook

There's little topside technical resistance of note for the USD/JPY except for last week's early jump towards 152.00 that saw the pair quickly tumble back to 149.00, but the next meaningful technical barrier sits at 2022's late swing high that fell just short of claiming 152.00 thirteen months ago.

The 50-day Simple Moving Average (SMA) has struggled to catch up to daily candlesticks, currently rising into 149.00, and long-term technical support is sitting far below current price action with the 200-day SMA rising into 141.00.

USD/JPY Daily Chart
USD/JPY Technical Levels

USD/JPY

Overview
Today last price150.99
Today Daily Change0.55
Today Daily Change %0.37
Today daily open150.44
 
Trends
Daily SMA20149.97
Daily SMA50148.8
Daily SMA100145.92
Daily SMA200140.58
 
Levels
Previous Daily High150.69
Previous Daily Low149.94
Previous Weekly High151.72
Previous Weekly Low148.81
Previous Monthly High151.72
Previous Monthly Low147.32
Daily Fibonacci 38.2%150.4
Daily Fibonacci 61.8%150.23
Daily Pivot Point S1150.02
Daily Pivot Point S2149.6
Daily Pivot Point S3149.27
Daily Pivot Point R1150.78
Daily Pivot Point R2151.12
Daily Pivot Point R3151.54

Author

Joshua Gibson

Joshua joins the FXStreet team as an Economics and Finance double major from Vancouver Island University with twelve years' experience as an independent trader focusing on technical analysis.


More from Joshua Gibson
Share:

Editor's Picks

GBP/USD dips below 1.3350 as USD demand surges

GBP/USD extends its intraday slide and closes in on 1.3300 in the American session on Thursday. The pair remains under heavy bearish pressure as the US Dollar (USD) benefits from the risk-averse market atmosphere amid escalating geopolitical tensions in the Middle East.

EUR/USD drops toward 1.1350 post ECB decision

EUR/USD remains under heavy bearish pressure in the second half of the day on Thursday and trades at its lowest level in three weeks below 1.1370. The ECB's cautious tone on policy tightening in the near future and the broad-based US Dollar (USD) strength on risk-aversion drag the pair lower.

Gold trims gains, dips to $4,050

Gold keeps retreating on Thursday, trading well below $4,100 early in the American session. US crude oil prices climb to a fresh six-week high above $90 amid a further escalation of tensions between the US and Iran, fueling inflation fears and bolstering US Fed interest rate hike expectations. Hawkish Fed bets weigh negatively on the yieldless bullion.

XRP Price Forecast: XRP trades sideways as Ripple targets 10 million agentic AI transactions
Ripple (XRP) is losing momentum on Thursday, albeit gradually, trading above $1.13. The remittance token tagged a weekly high of $1.16 on Tuesday, with gains mainly attributed to developments on the United States (US) Clarity Act and recent signs that inflation is easing in the world’s largest economy.
Bitcoin falls as surging Oil prices revive inflation concerns

Bitcoin extends its correction, trading below $65,800 after a modest decline in the previous day. Despite BTC’s fading strength, US-listed spot Bitcoin Exchange Traded Funds continued to attract institutional inflows on Wednesday, marking the seventh consecutive day of gains.

US Dollar mid-year outlook: Exceptional currency, exceptional risks?
The US Dollar enters the second half of 2026 in a markedly different position from a year ago. The King currency has recovered, reflecting persistent US inflation, changing expectations for Fed policy, geopolitical tensions and renewed demand for defensive assets.












