|

USD/JPY Technical Analysis: US Dollar bulls defend the 108.50 level
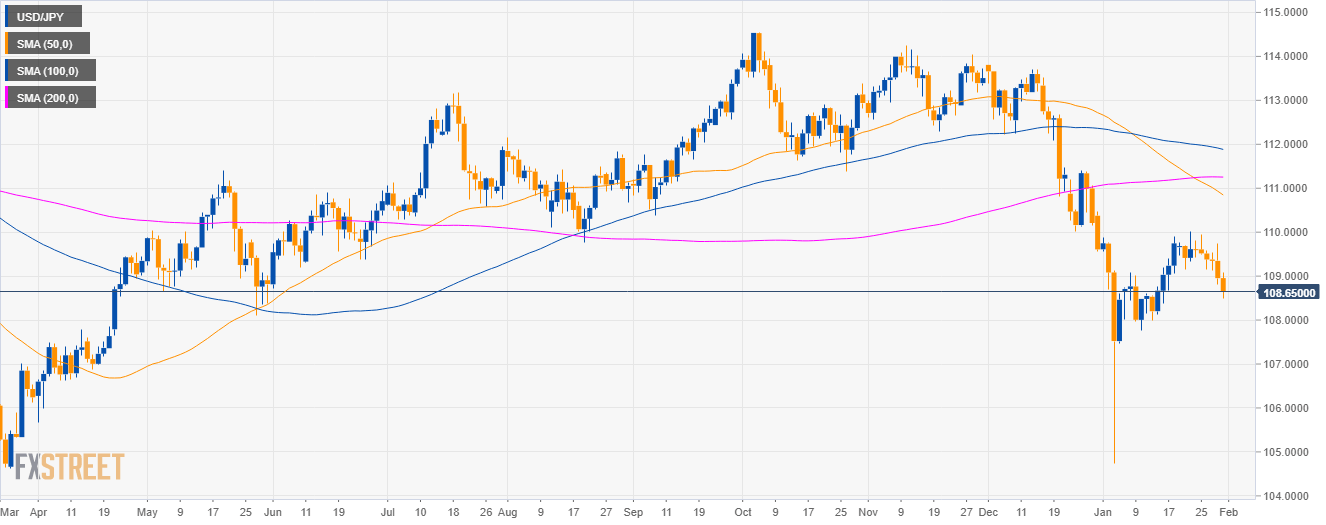
USD/JPY daily chart

  • USD/JPY is trading in a deep pullback below the 50, 100 and 200-day simple moving averages (SMAs) on the daily chart.

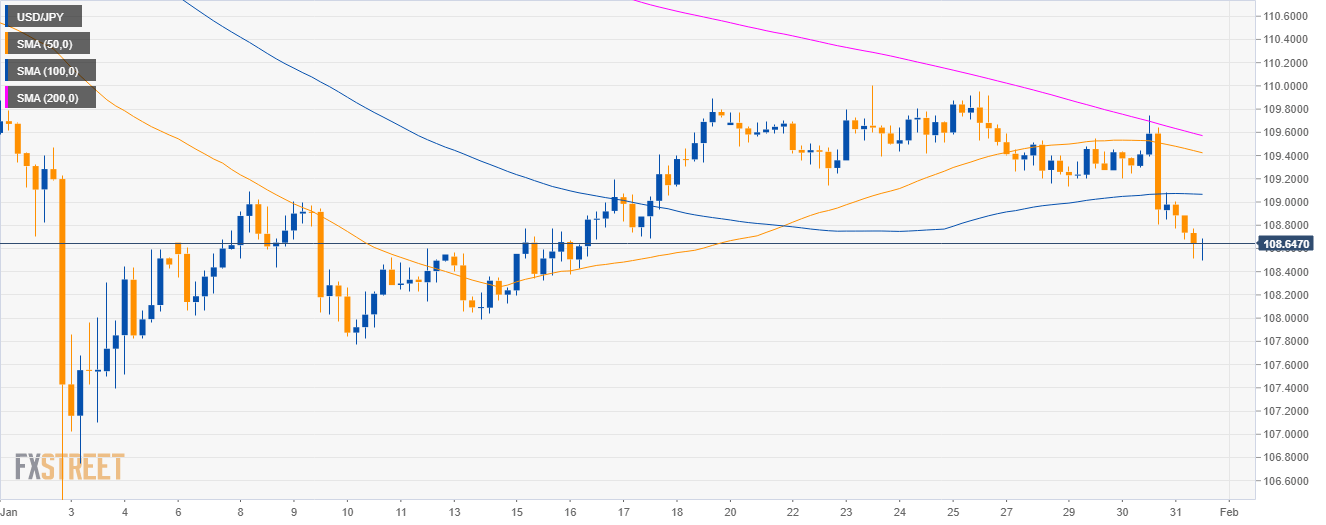
USD/JPY 4-hour chart

  • USD/JPY is trading below the 50 and 200 SMA suggesting bearish momentum in the medium-term. 

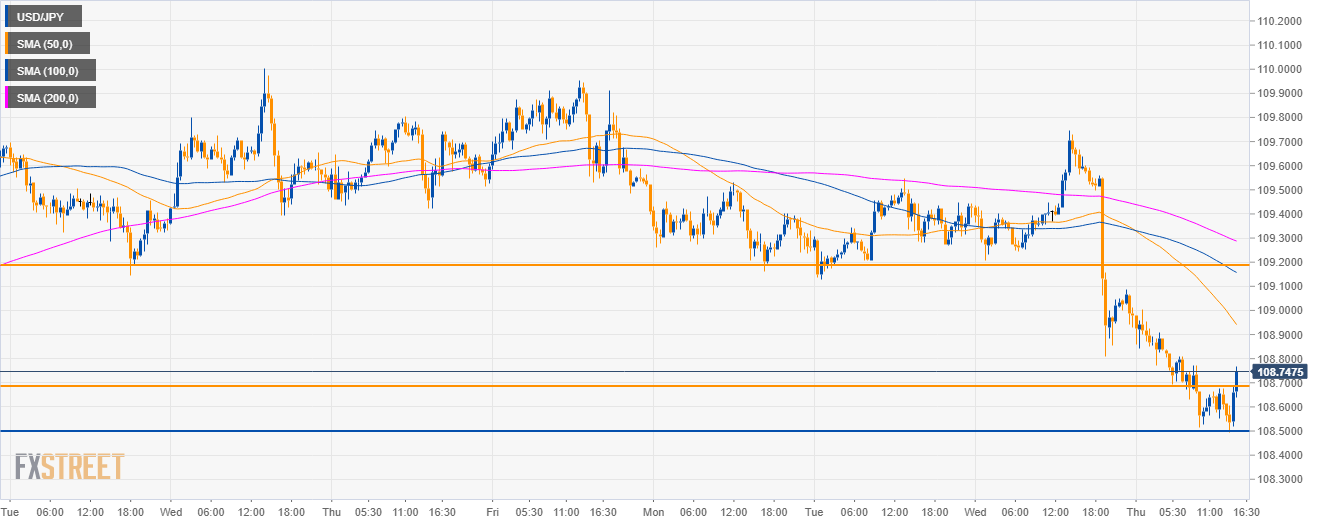
USD/JPY 30-minute chart

  • USD/JPY exceeded the 108.70 target as bears drove the market as low as 108.50 this Thursday.
  • To the upside, Greenback bulls can reach 109.20 as long as 108.50 support holds.

Additional key levels

USD/JPY

Overview:
    Today Last Price: 108.66
    Today Daily change: -29 pips
    Today Daily change %: -0.27%
    Today Daily Open: 108.95
Trends:
    Daily SMA20: 108.94
    Daily SMA50: 110.93
    Daily SMA100: 111.92
    Daily SMA200: 111.26
Levels:
    Previous Daily High: 109.74
    Previous Daily Low: 108.81
    Previous Weekly High: 110
    Previous Weekly Low: 109.14
    Previous Monthly High: 113.83
    Previous Monthly Low: 109.55
    Daily Fibonacci 38.2%: 109.17
    Daily Fibonacci 61.8%: 109.39
    Daily Pivot Point S1: 108.59
    Daily Pivot Point S2: 108.23
    Daily Pivot Point S3: 107.65
    Daily Pivot Point R1: 109.53
    Daily Pivot Point R2: 110.11
    Daily Pivot Point R3: 110.47

Author

Flavio Tosti

Flavio Tosti

Independent Analyst


More from Flavio Tosti
Share:

Markets move fast. We move first.

Orange Juice Newsletter brings you expert driven insights - not headlines. Every day on your inbox.

By subscribing you agree to our Terms and conditions.

Editor's Picks

EUR/USD retreats toward 1.1700 on modest USD recovery

EUR/USD stays under mild bearish pressure and trades below 1.1750 on Friday. Although trading conditions remain thin following the New Year holiday and ahead of the weekend, the modest recovery seen in the US Dollar causes the pair to edge lower. The economic calendar will not feature any high-impact data releases.

GBP/USD struggles to gain traction, stabilizes near 1.3450

After testing 1.3400 on the last day of 2025, GBP/USD managed to stage a rebound. Nevertheless, the pair finds it difficult to gather momentum and trades marginally lower on the day at around 1.3450 as market participants remain in holiday mood.

Gold climbs toward $4,400 following deep correction

Gold advances toward $4,400 and gains more than 1.5% on the day after suffering heavy losses amid profit-taking heading into the end of the year. Growing expectations for a dovish Fed policy and persistent geopolitical risks seem to be helping XAU/USD stretch higher.

Cardano gains early New Year momentum, bulls target falling wedge breakout

Cardano kicks off the New Year on a positive note and is extending gains, trading above $0.36 at the time of writing on Friday. Improving on-chain and derivatives data point to growing bullish interest, while the technical outlook keeps an upside breakout in focus.

Economic outlook 2026-2027 in advanced countries: Solidity test

After a year marked by global economic resilience and ending on a note of optimism, 2026 looks promising and could be a year of solid economic performance. In our baseline scenario, we expect most of the supportive factors at work in 2025 to continue to play a role in 2026.

Crypto market outlook for 2026

Year 2025 was volatile, as crypto often is.  Among positive catalysts were favourable regulatory changes in the U.S., rise of Digital Asset Treasuries (DAT), adoption of AI and tokenization of Real-World-Assets (RWA).