|

USD/JPY technical analysis: The greenback is under pressure against the Japanese Yen

  • USD/JPY is under bearish pressure below the 107.10 resistance.
  • The level to beat for bears is the 106.70 level. 
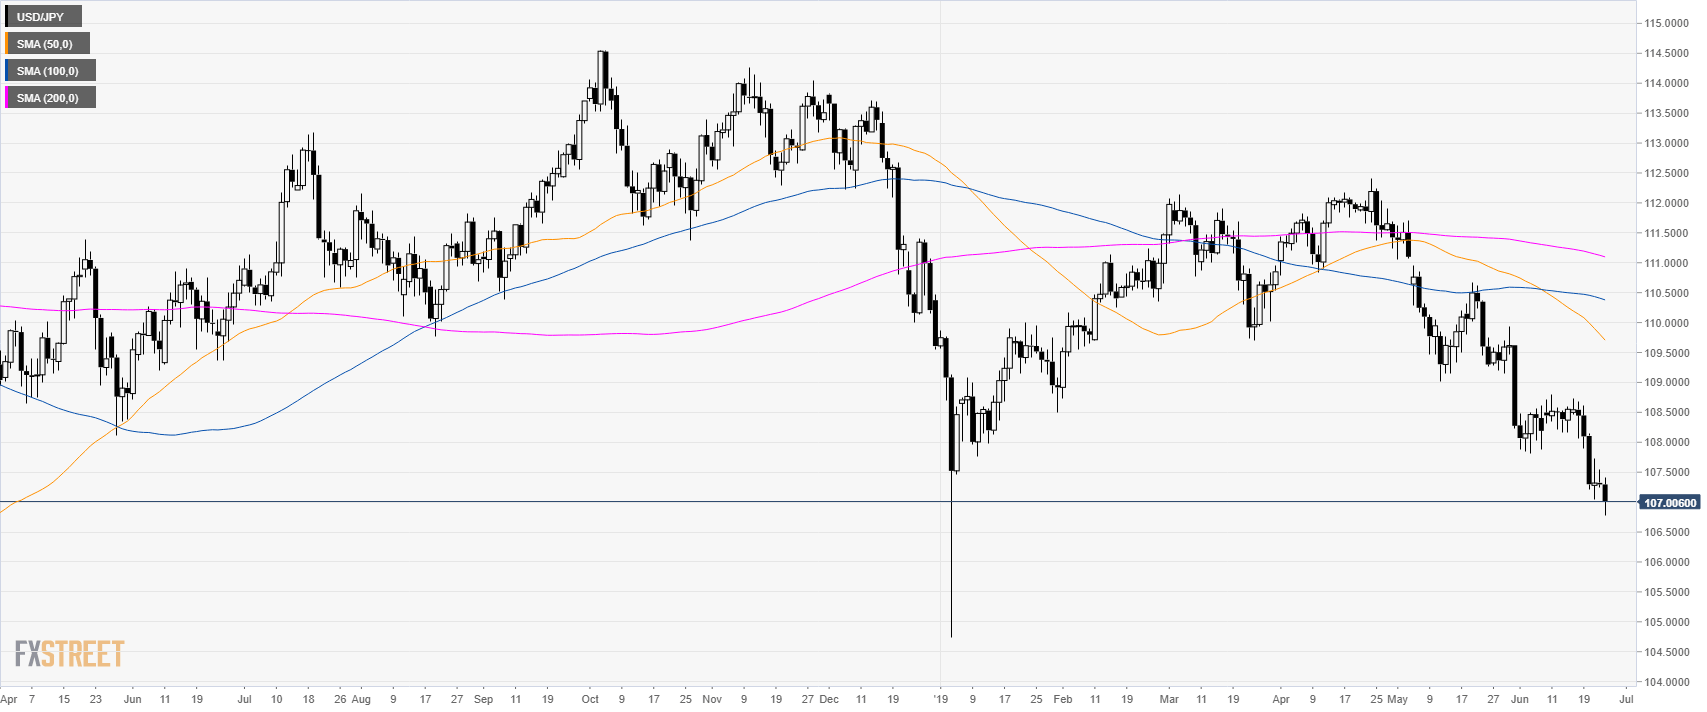
USD/JPY daily chart 

USD/JPY is in a bear trend below its main daily simple moving averages (DSMAs). The 50 DSMA crossed below the 100 DSMA which is seen as bearish. 


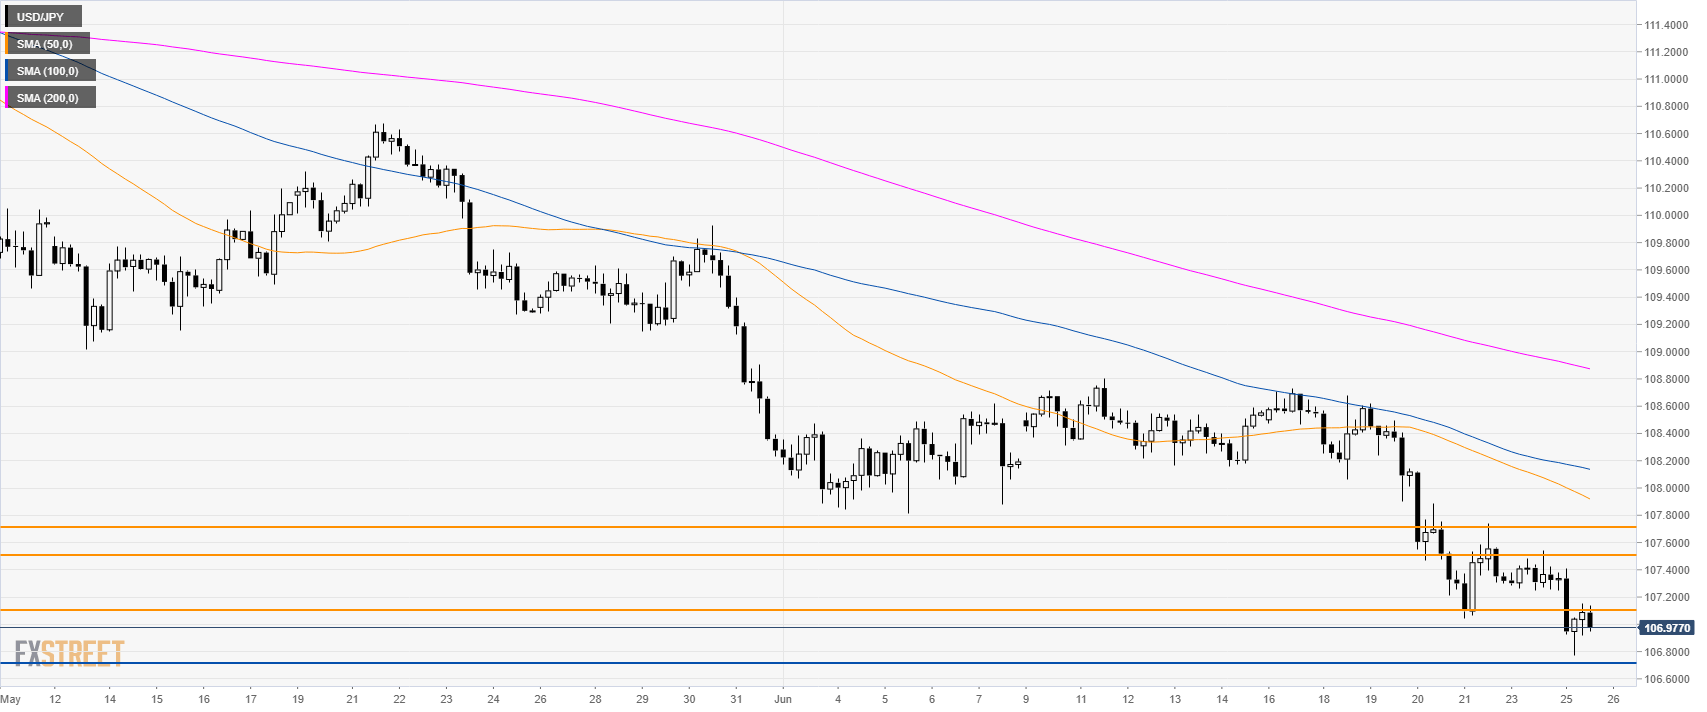
USD/JPY 4-hour chart

USD/JPY is trading below its main SMAs suggesting bearish momentum in the medium term. The market is finding some support near 107.00.

USD/JPY 30-minute chart

A break above 107.10 could open the doors to 107.50/70 resistance according to the Technical Confluences Indicator. On the flip side, a break below 106.70 on a daily closing basis can see the main bear trend resuming and open the doors for a bigger drop to the 106.00 figure.


Additional key levels

USD/JPY

Overview
Today last price107.02
Today Daily Change-0.28
Today Daily Change %-0.26
Today daily open107.3
 
Trends
Daily SMA20108.38
Daily SMA50109.81
Daily SMA100110.41
Daily SMA200111.13
Levels
Previous Daily High107.54
Previous Daily Low107.24
Previous Weekly High108.73
Previous Weekly Low107.04
Previous Monthly High111.71
Previous Monthly Low108.23
Daily Fibonacci 38.2%107.36
Daily Fibonacci 61.8%107.43
Daily Pivot Point S1107.18
Daily Pivot Point S2107.07
Daily Pivot Point S3106.89
Daily Pivot Point R1107.48
Daily Pivot Point R2107.65
Daily Pivot Point R3107.77

Author

Flavio Tosti

Flavio Tosti

Independent Analyst


More from Flavio Tosti
Share:

Editor's Picks

EUR/USD recovers further from one-month low set on Friday, eyes mid-1.1800s on weaker USD

The EUR/USD pair is seen building on Friday's late recovery from the 1.1750-1.1740 region, or a nearly one-month trough, and gaining some follow-through positive traction at the start of a new week. The momentum lifts spot prices to the 1.1835 area during the Asian session and is sponsored by a broadly weaker US Dollar.

GBP/USD gathers strength above 1.3500 amid tariff confusion

The GBP/USD pair gains traction to around 1.3520 during the early Asian session on Monday. The US Dollar faces some selling pressure against the Cable as tariff uncertainty lingers. Traders will take more cues from the US Producer Price Index report for January, which will be published later on Friday. 

Gold eyes a daily closing above key 61.8% Fibo resistance

Gold is adding over 1% early Monday, after having gained 2% on Friday. The bright metal scales key technical hurdles, as buyers stay strong amid renewed tariffs and economic uncertainty alongside looming US-Iran geopolitical tensions.

Top Crypto Losers: Zcash, Pump.fun, and LayerZero extended losses as Bitcoin loses $65,000

The cryptocurrency market starts the week in panic mode, with altcoins Zcash, Pump.fun, and LayerZero. Bitcoin falls below $65,000 as the US President Donald Trump regroups amid renewed trade policy risks.

Liberation day take two, the tariff machine just changed gears

Let me caveat this from the outset. What we are watching is first-order mechanics, not the grand macro endgame. This is the market’s immediate reflex to a 15% Trump tariff levy dressed up as judicial drama. The Supreme Court blocked Trump tarrif hammer. The White House came back with a scalpel.

Top Crypto Losers: Zcash, Pump.fun, and LayerZero extended losses as Bitcoin loses $65,000

The cryptocurrency market starts the week in panic mode, with altcoins Zcash, Pump.fun, and LayerZero. Bitcoin falls below $65,000 as the US President Donald Trump regroups amid renewed trade policy risks.