USD/JPY Technical Analysis: The 113.00 level and 50-day simple moving average are acting as resistance

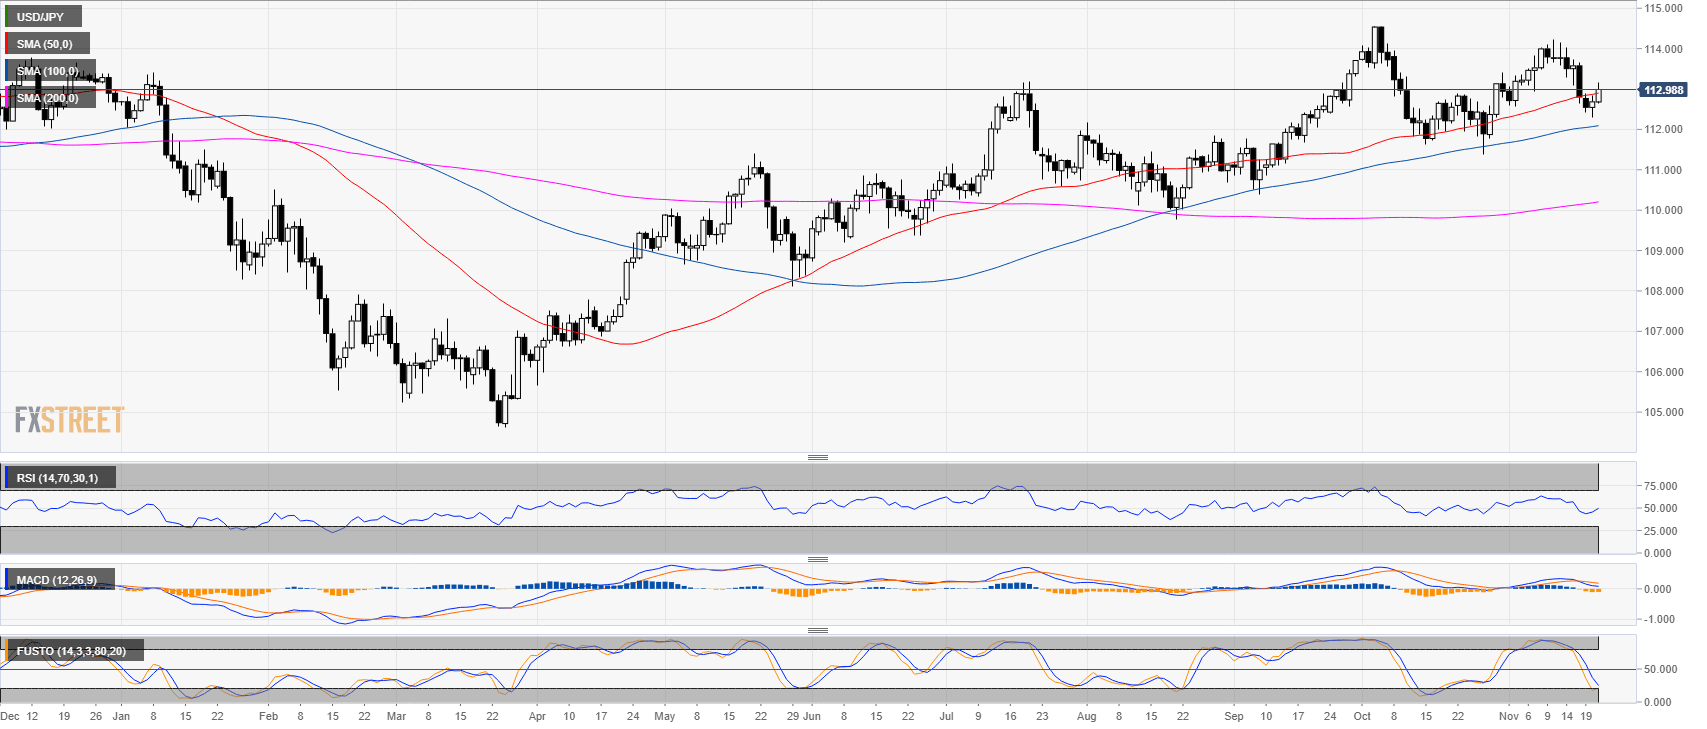
USD/JPY daily chart
- USD/JPY is challenging the 113.00 figure and the 50 SMA.
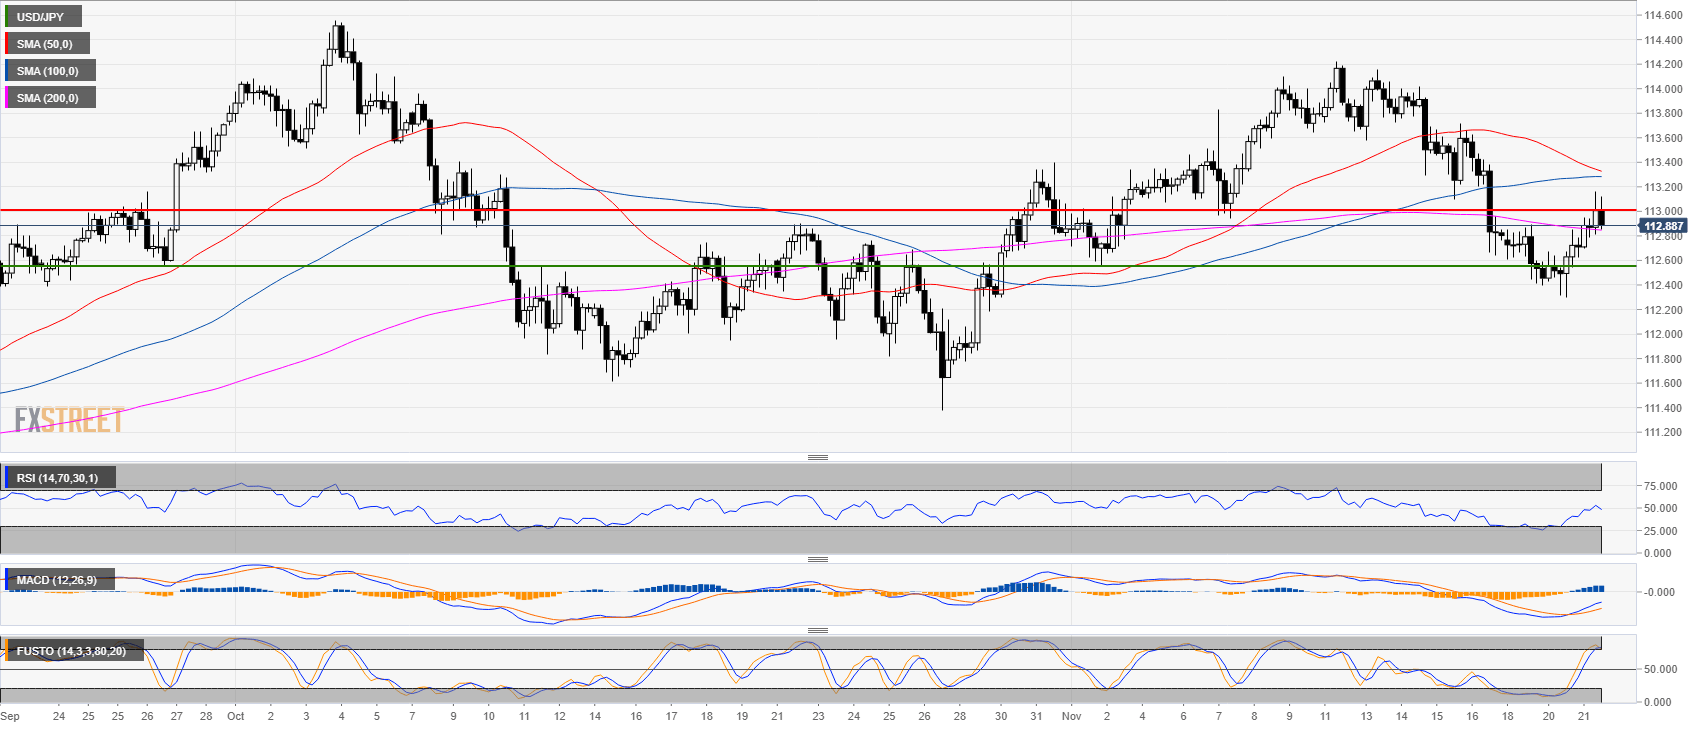
USD/JPY 4-hour chart
- USD/JPY is currently trapped between the 113.00 figure and the 200-period simple moving average.
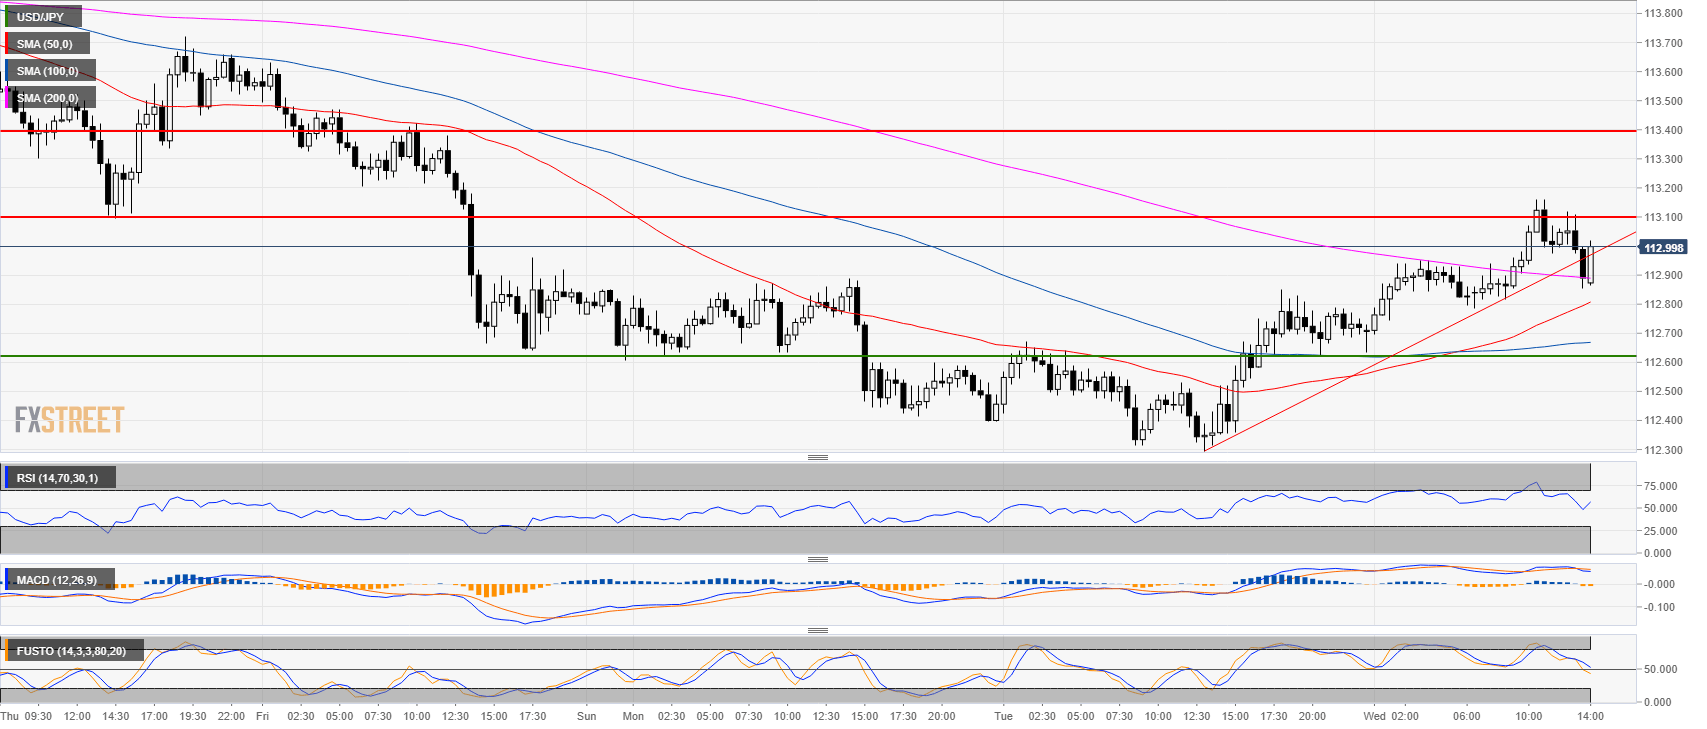
USD/JPY 30-minute chart
- USD/JPY reclaimed the 50, 100 and 200-period simple moving averages on the 30-minute chart.
- Bears broke below the trendline as technical indicators are decelerating.
- The target for bears is the 112.60. On the flip side, a break of 113.00 to the upside can lead to the 113.40 level.
Additional ley levels at a glance:
USD/JPY
Overview:
Last Price: 112.89
Daily change: 21 pips
Daily change: 0.186%
Daily Open: 112.68
Trends:
Daily SMA20: 113.08
Daily SMA50: 112.87
Daily SMA100: 112.07
Daily SMA200: 110.18
Levels:
Daily High: 112.85
Daily Low: 112.3
Weekly High: 114.22
Weekly Low: 112.64
Monthly High: 114.56
Monthly Low: 111.38
Daily Fibonacci 38.2%: 112.64
Daily Fibonacci 61.8%: 112.51
Daily Pivot Point S1: 112.37
Daily Pivot Point S2: 112.05
Daily Pivot Point S3: 111.81
Daily Pivot Point R1: 112.92
Daily Pivot Point R2: 113.16
Daily Pivot Point R3: 113.48
Author

Flavio Tosti
Independent Analyst


